Cardano (ADA), IOTA (MIOTA) and Tron (TRX) Price Analysis

After a slow weekend, the various digital coins have had a hard time picking an upward momentum. This has occasioned a dip in the Relative Strength indexes signaling reduced investor sentiments. Additionally, for all of today’s focus coins, the 30-day Moving averages are above the 9 day moving averages with the former acting like the price support. Additionally, previous support zones have been tested and breached which indicates a strong Bearish momentum.
ADA/USD

The ADA/USD pair is down by 2.2%, having begun off trading at $0.045 against the current rate of $0.043. Support holds at $0.042 and resistance is at $0.047.
In the markets, ADA has a market capitalization of $1.116 Billion and sold $16 Million over the last 24 hours. This is as shown in the Relative Strength Index (A) which has taken a slight dip. The RSI is in the middle zone indicating that the coin is neither oversold nor overbought.
The bearish momentum looks set to continue seeing that the 9 days EMA (C) is below the 30 day EMA (B). However, there have been spirited efforts from the Bulls which may help the market achieve correction.
IOTA/USD
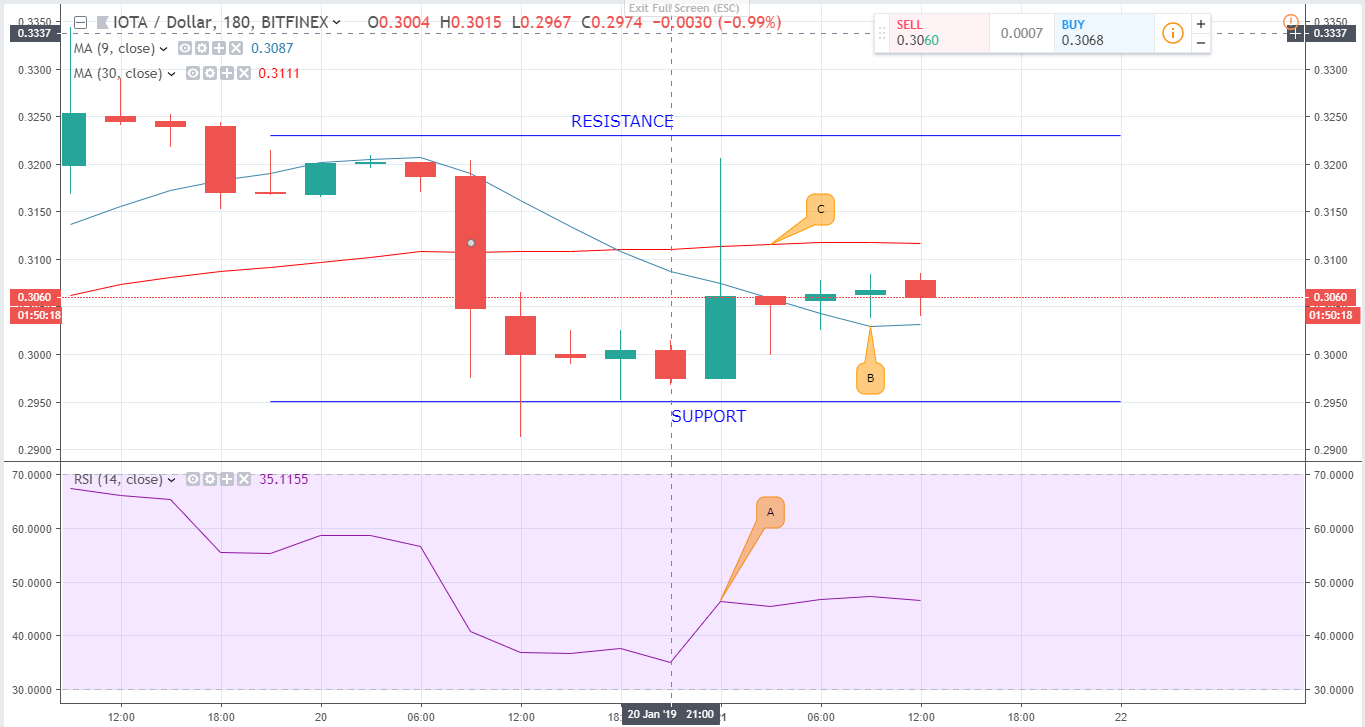
The IOTA/USD pair has undergone a Bearish run which has seen it drop from $0.3169 yesterday to the current $0.3027. This translates to a 2.8% drop in the value of IOTA. The Bearish run was marked with the 30-day Moving Average (C) crossing over the 9-day Moving Average (B). The latter EMA is currently acting as price support which shows that the drop may go on in the short term.
The support level was tested and breached once before a slight upward reversal occurred. In the markets, the RSI (A) has found support in the middle zone which shows that investors are confident about IOTA’s run.
TRX/USD
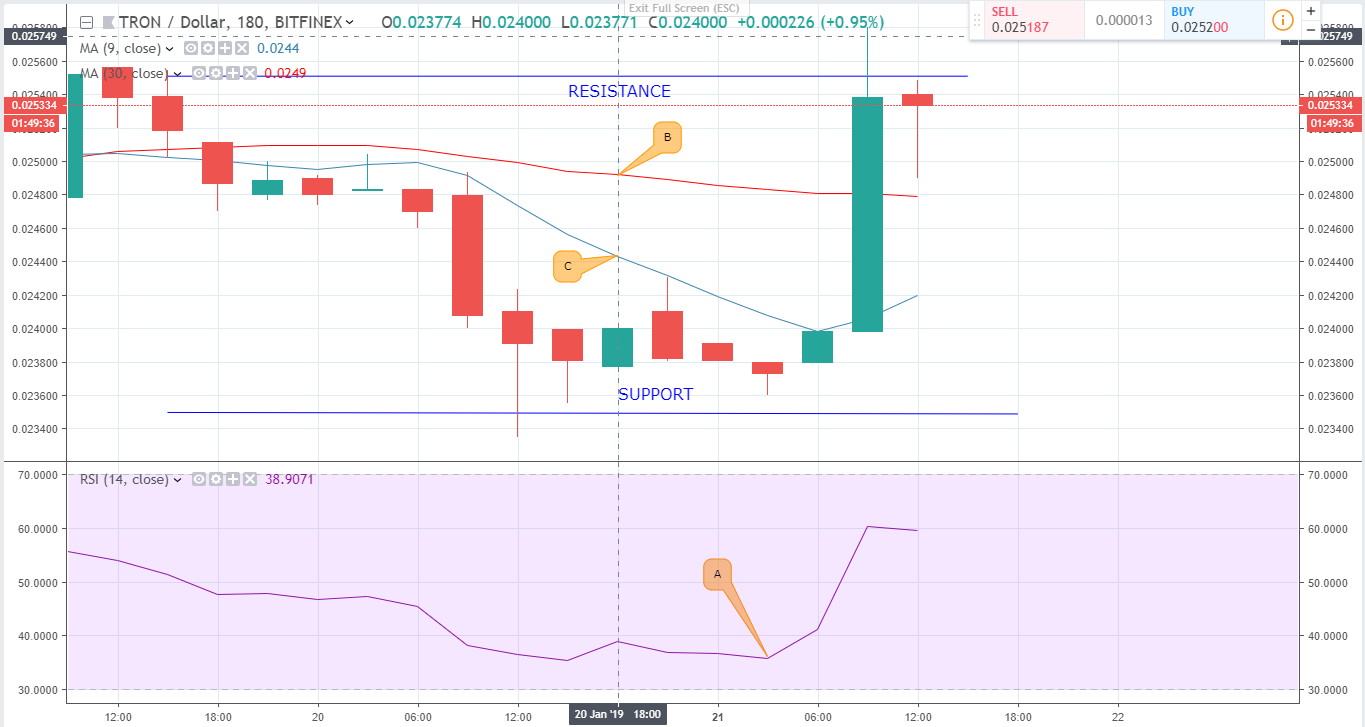
The TRX/USD pair is up by 5% over the last 24 hours. The pair started off selling at $0.02489 and is now at $0.025401. The slight increase has seen investor sentiments rise as can be seen in the Relative Strength Index (A). The RSI is at 60 which is closer to 70 than to 30. This means that the tendency to sell off TRX holdings has reduced as a result of the increase in its price.
The 30 day EMA (B) has been dominantly above the 9 day EMA (C) which signals a strong Bearish momentum. in the short term, the Bearish trend is likely to continue unless the Bulls can up their momentum.
The post Cardano (ADA), IOTA (MIOTA) and Tron (TRX) Price Analysis appeared first on ZyCrypto.