Ethereum Price Analysis: ETH/USD Trends of January 22–28, 2019
CoinSpeaker
Ethereum Price Analysis: ETH/USD Trends of January 22–28, 2019
Key Highlights:
- Consolidation movement confirmed in the Ethereum market;
- the breakout is imminent;
- ETH price may rally towards $145 in case $109 price level holds.
ETH/USD Long-term Trend: Bearish
Supply levels: $131, $146, $164
Demand levels: $109, $87, $82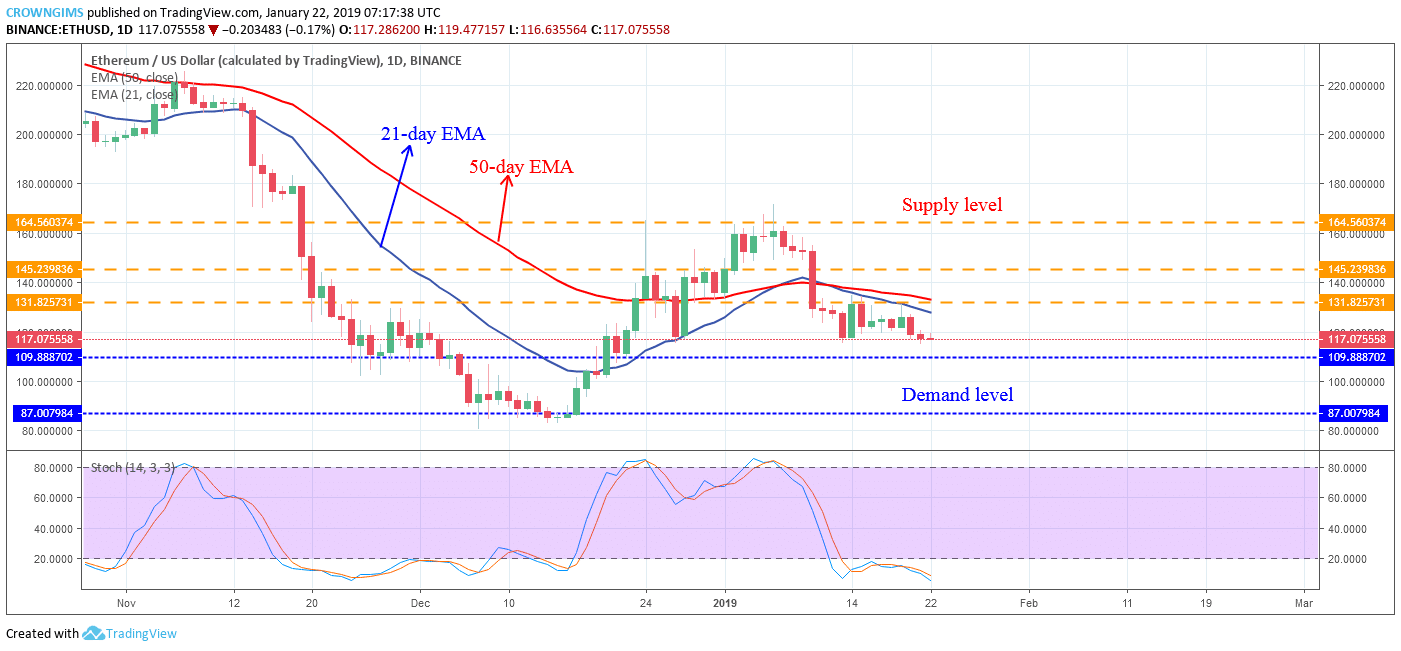 ETH/USD is on the bearish trend on the long-term outlook. The breaking down of the demand level of $109 was not possible last week for the bears due to low momentum. Likewise, the bulls made attempt on January 14 to break up the supply level of $131 by the formation of bullish engulfing candle pattern but lose the pressure and were unable to push the coin to penetrate the supply level of $131 due to the confluence at the mark; this led to the current sideways movement.
The bears were in control of the ETH market as it can be seen clearly on the daily chart; Ethereum price is trading below the 21- day EMA and the 50-day EMA with the former crossed the later downside. The stochastic Oscillator period 14 is below 20 levels (oversold level) with its signal lines points down connotes that there will be further declination of ETH price which may have its target at the previous low of $87 in case the demand level of $109 does not hold. Should the demand level of $109 hold, the Ethereum price will bounce and rally towards $145 price level.
ETH/USD Medium-term Trend: Bearish
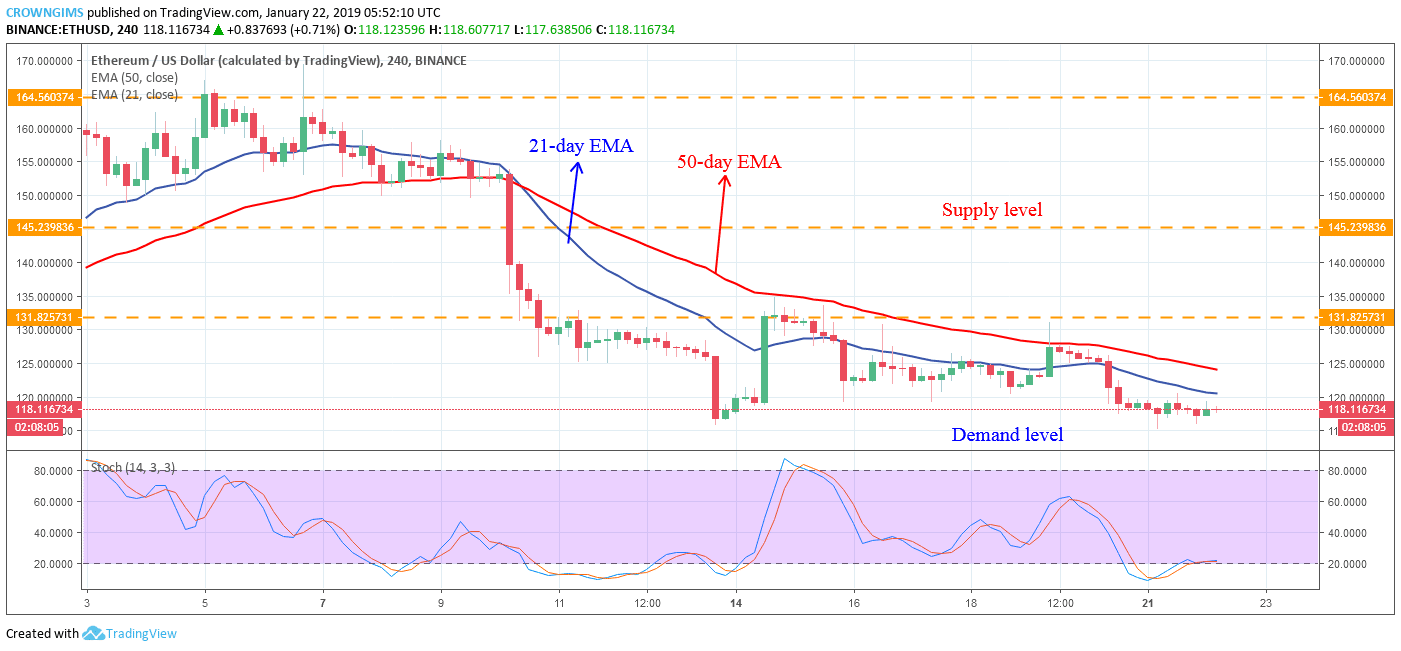 ETH is on the strong bearish trend on the medium-term outlook. The Bearish pressure on the Ethereum price was noticed on January 10 as the massive strong bearish candle formed which made the coin bottomed around the demand level of $109. Further price declination was opposed by the bulls as the bullish inside bar candle pattern formed and the ETH price rallied towards the supply level of $131 where it was resisted and the price fell back to its previous low. The coin is currently facing the demand level of $109.
The 50-day EMA is above the 21-day EMA and the coin is trading below the two EMA as an indication of bears’ pressure in the ETH market. However, the Stochastic Oscillator period 14 is on the 20 levels (oversold level) with the signal lines horizontally flat on the level which indicate that consolidation is ongoing and may continue for a while. Traders should remain flat until the breakout.
Ethereum Price Analysis: ETH/USD Trends of January 22–28, 2019