Litecoin Price Analysis: LTC Must Breach $50, Keys to $70 and Beyond
Latest Litecoin News
After weathering 13 months of strong waves of sell pressure and dipping prices, most miners were shaken out. The result was a dip in the network’s hash rate—the measure of the coin’s security and resilience.
Read: Forbes Launches Crypto Newsletter For Investors, Institutions Coming
It was all across the board and most proof of work powered systems took a hit simply because miners—in their quest for profitability couldn’t break even as PoW systems are power hungry. Power is an expenditure, a variable whose cost depends mainly on consumption levels.
Thanks to recovering asset prices, data from BitInfocharts point to increasing hash rate coming at a time when the network security slid 30 percent from peaks of around 320 TH/s—where it is assumed that had miners received their gear orders promptly, hash rate would have crossed the 1EH/s level.
Also Read: Spend App Now Supports Litecoin In Over 40 Million Stores Worldwide
Anyhow, at that time each Litecoin retailed at $120 a pop but in late 2018, hash rate had more than halved, bottoming up from 140TH/s in Dec 2018. Then, LTC prices were trending at around the $23 zone. It is clear that Litecoin’s hash rate is mainly tied with asset prices. The more the expansion, the more profitable mining becomes.
At the moment, Litecoin’s hash rate is at 218 TH/s meaning profitability is $2.882. However, it is increasingly clear that the more prices are in doldrums, miners will back out, leaving the network exposed.
LTC/USD Price Analysis

At fifth, Charlie Lee projections of Litecoin finally flipping Bitcoin Cash is true. Litecoin (LTC), is this week’s top performer, adding an impressive 25.6 percent at the time of writing. With favorable candlestick formation and the activation of our previous LTC/USD trade conditions, trend direction has been defined. Therefore, it is upon traders to look for undervaluation in lower time frames, refine their entries and aim for $50, $70 and even $90 as prices climb back from 2018 pits.
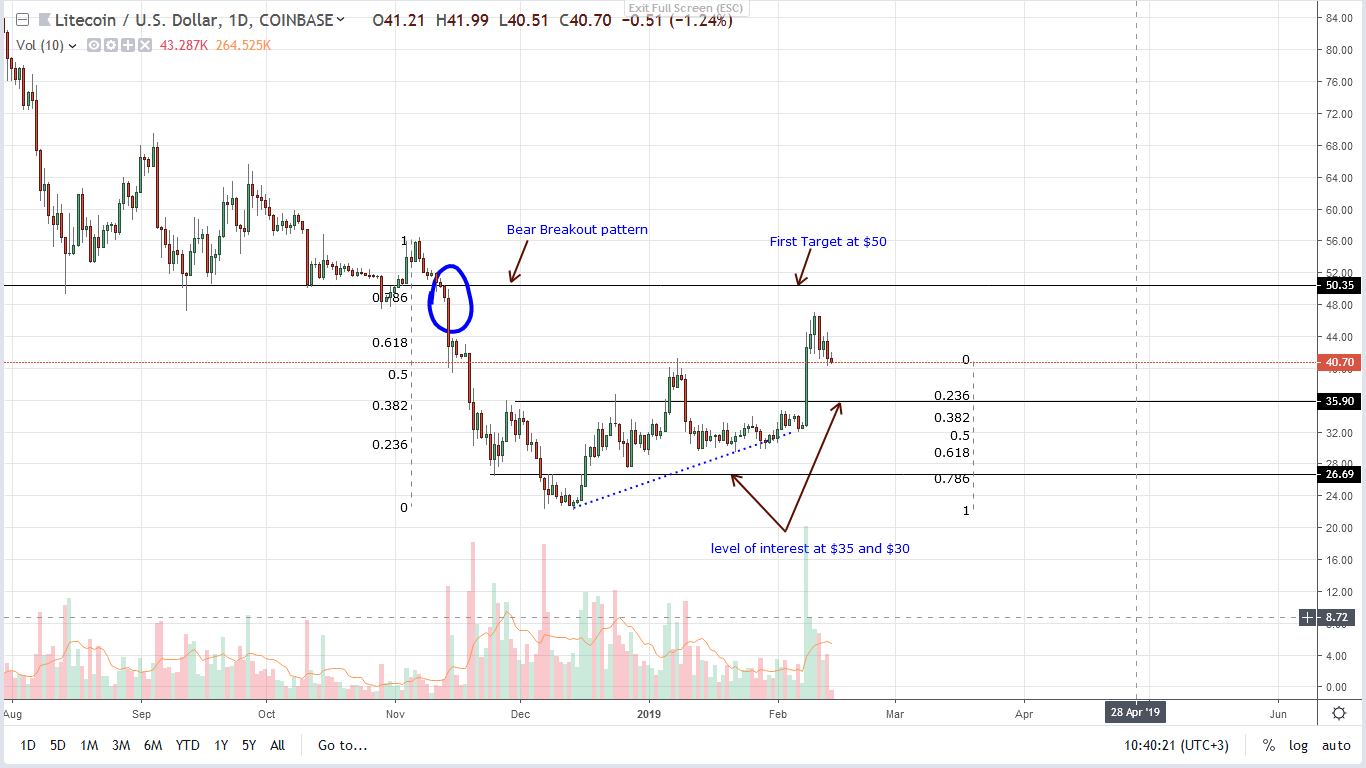
Trend and Candlestick Formation: Bearish, Breakout Pattern
The climactic expansion of LTC prices on Feb 8 is very bullish—at least in the short term. However, when we take a sober approach and deeply analyze price action, it is apparent that LTC is trading within a bear breakout pattern with clear resistance at $50.
From the weekly chart, this level is previous support and for bullish confirmation, all we need is a strong wave of bull pressure with equally high volumes racing above $50, activating risk-averse long positions set above $50 as laid out in our previous LTC/USD trade plans.
All the same, our trade conditions were met when bulls drove prices above $35. As such, aggressive traders can buy on dips with immediate support at $35. First targets will be at $50—our primary resistance level and if there is sufficient moment resulting in a breakout, first target will be at $70.
Volumes: Bullish
Buyers are in control and revealing their presence is Feb 8 candlestick and our anchor bar. It has high volumes—830k, which is above recent averages of around 250k. For trend continuation, there must be a confirming bar—a possibility now that the last three bars are trending inside Feb 8 bar meaning buyers are technically in charge from an effort versus result point of view. Any surge propelling prices above $50 should be pumped by above average volumes exceeding 250k and even 830k.
All charts courtesy of Trading View—CoinBase.
This is not Investment Advice. Do your Research.
The post Litecoin Price Analysis: LTC Must Breach $50, Keys to $70 and Beyond appeared first on Ethereum World News.