Stellar (XLM), XRP and Bitcoin (BTC) Price Analysis and Forecast

XLM-USD
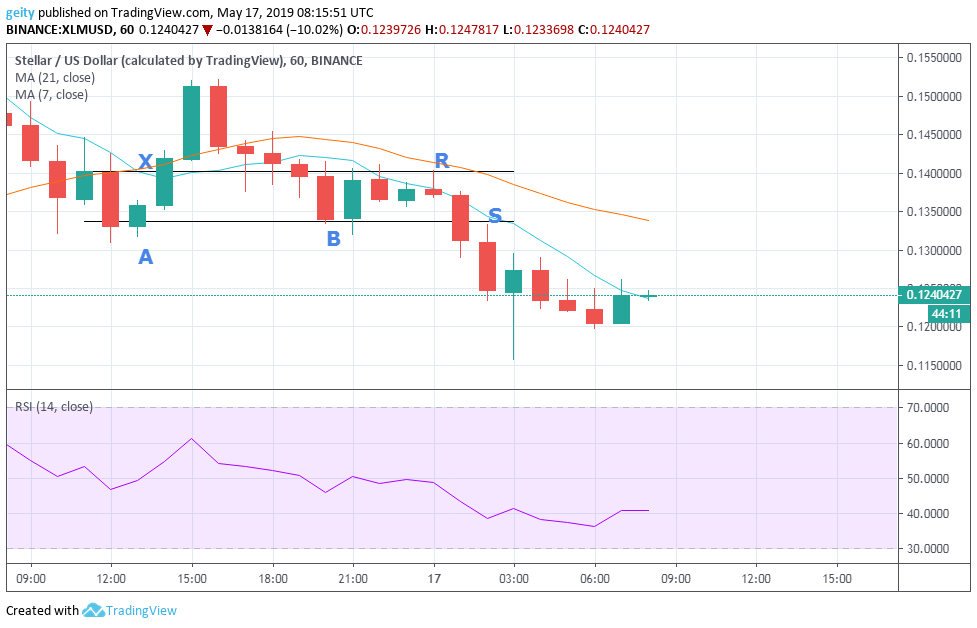
A bearish outlook is observed in the last 24hrs. The downward price rally has been buttressed by both moving averages which are heading south.
The day began when the XLM/USD pairs where trading at $0.13681; it was then further dropped to a low of $0.13090. The resistance level is seen at $0.14020 and support level (S) is seen at $0.13371. The 7 days MA is seen above the 21-day MA earlier during the day indicating a bullish signal; this was later followed by an upward price rally (A) that breached resistance level to close to a high of $0.15198.
Later on, the 21-day MA crossed over the 7-day MA (X) indicating bearish signals showing that the bears have the upper hand thus resulting to a dip in price that breached support and continuously dropped to a low of $0.11972. XLM is currently trading at $0.12404, this shows that the price has dip thus increase buyout. The RSI confirms the dip in price since is slightly dropping.
FORECAST
The 21 day MA is still above the 7 day MA indicating bearish momentum is likely to continue in the next few hours. New support target should be considered at $0.1200.
XRP-USD
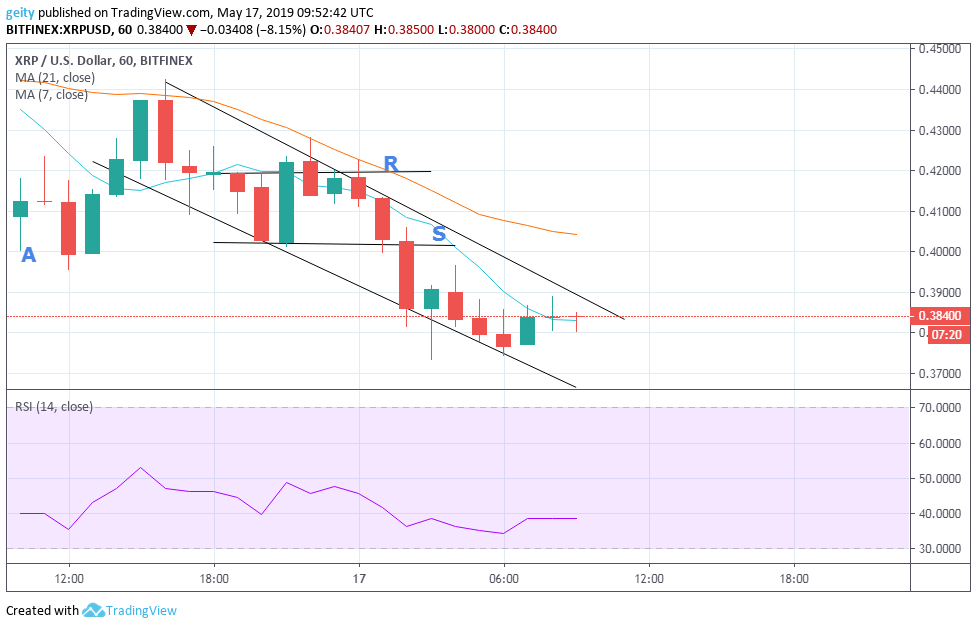
Despite a bearish outlook, the day began with a bullish momentum (A) where the price rally was pushed up to close at $0.43739.
Later on, the XRP is seen in an ascending channel with price retesting resistance zone (R) and later breached support zone (S). The resistance level is at $0.41977 and support level is at $0.40228. A downtrend is observed and confirmed by the 21day MA which is seen above the 7 day MA indicating a bearish signal.
XRP/USD pair started trading at $0.41275 and is currently trading at $0.38400 showing a dip in pair’s price.
FORECAST
The RSI is seen between 70 and 30 this shows that the price momentum is likely to continue in the next few hours thus a bearish price rally is to be expected. New target should be set at $0.36963 and stop-loss to be placed slightly below the target.
BTC-USD
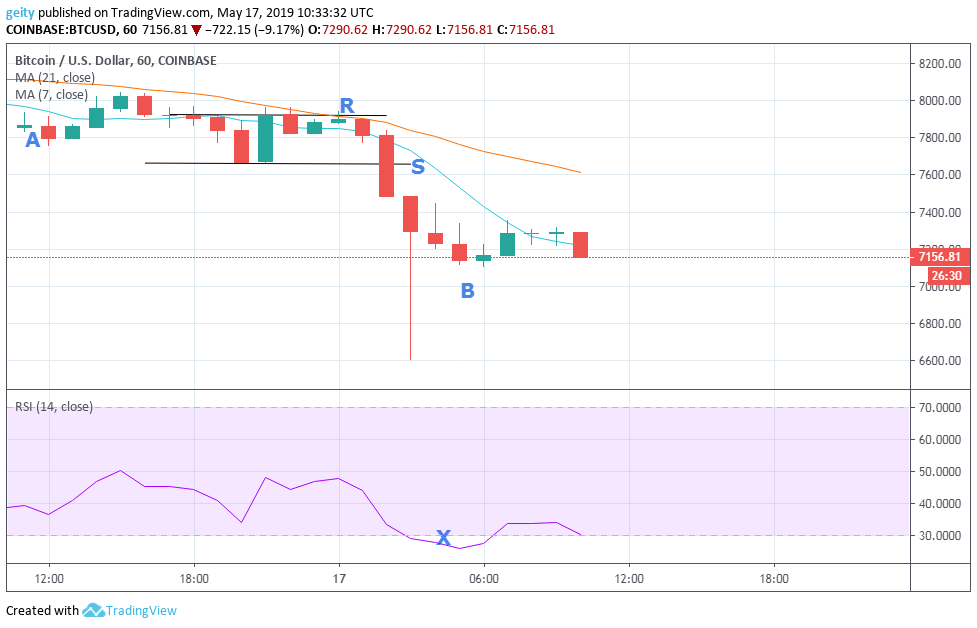
Presence of a bearish rally is observed in the last 24hrs, where the day began trading at a high of $7934.45.
The 21 day MA is above the 7 day MA indicating a bearish signal. The bulls later pushed the price up to a high of $8041.33 but the bears were stronger enough to pull the price rally back down, placing support level (S) at $7660.66 and resistance level (R) at $7918.57. Resistance level was tested severally while support level was breached.
Later on, the price was further pushed past support to close at $7138.02. The RSI is seen below 30 at (X) indicating oversold market at that period of time that led to an upward price rally later on. BTC has shown a dip in price since its currently trading at $7156.81 thus increase buyouts.
FORECAST
A bearish run is likely to continue, this is confirmed by the RSI which is heading downwards and the 21 moving average which is still above the 7-day moving average. New support level should be set at $7020.13 and stop-loss should be set slightly above support in case a break out occurs.
The post Stellar (XLM), XRP and Bitcoin (BTC) Price Analysis and Forecast appeared first on ZyCrypto.