Price Analysis: ADA/USD Consolidating At $0.08, Bulls Await Phenomenal Breakout

Resistance levels: $0.08, $0.09, $0.10
Support levels: $0.07, $0.06, $0.05
ADA/USD Long-term Trend: Ranging
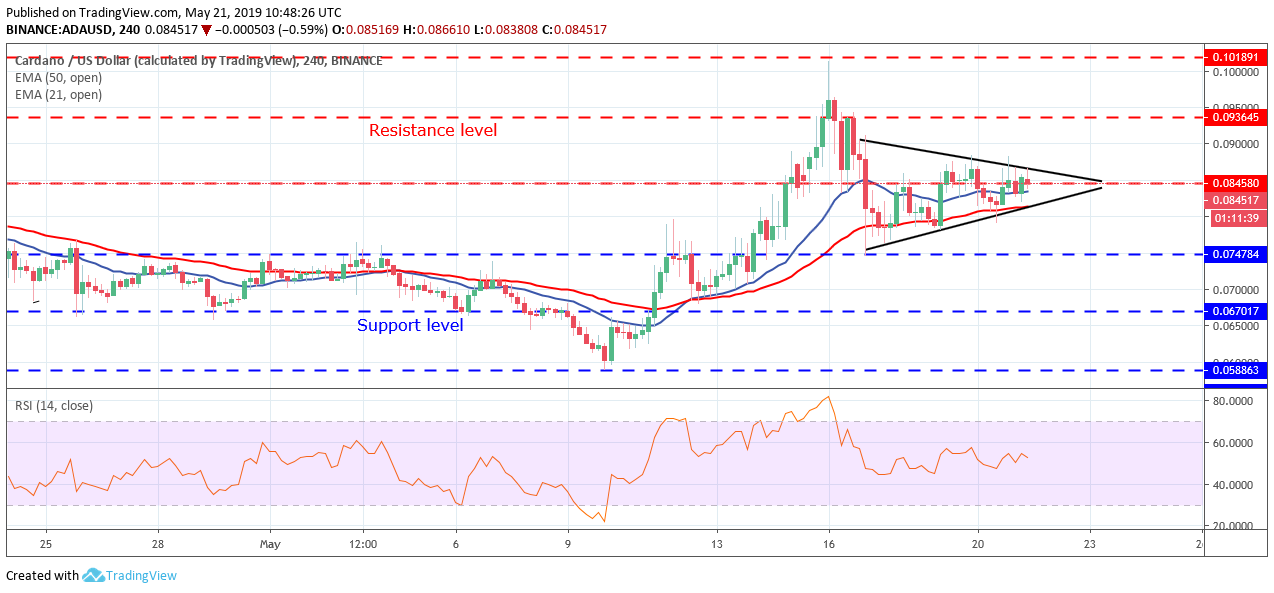
On the Long-term outlook, ADA/USD is on the sideways movement. ADAUSD was strongly bullish last week. The bullish momentum drove the price up with full pressure, broke up barriers at $0.07, $0.08 and $0.09 levels and topped at $0.10 resistance level. The Bears did not allow a further increase in Cardano price.
The price was pushed down, the strong bullish candle at $0.10 converted to upper long tail candlestick called inverted pin bar. This candle pattern triggers the bearish momentum and the price declined towards $0.07 level. Since that time, the momentum of the Bulls and the Bears seems to be equal and the price is moving sideways with the formation of the symmetrical triangle.
The breakout is imminent; which could either be at the upper trend line of the triangle or at the lower trend line. Cardano price is hovering over the 21-periods EMA and 50 periods EMA. The two EMAs are parallel on the 4-hour chart without specific direction; this indicates that consolidation is ongoing.
Meanwhile, the Relative Strength Index period 14 is at 50 levels with the signal line bending down to indicate sell signal. The breaking out of the price at the upper trend line of the triangle is guaranteed only in the increase of the Bull’s strength.
In case the Bears defend the price level of $0.08, there will be a breakout at the lower trend line of the triangle and ADA price may target $0.07 level.
ADA/USD Medium-term Trend: Ranging
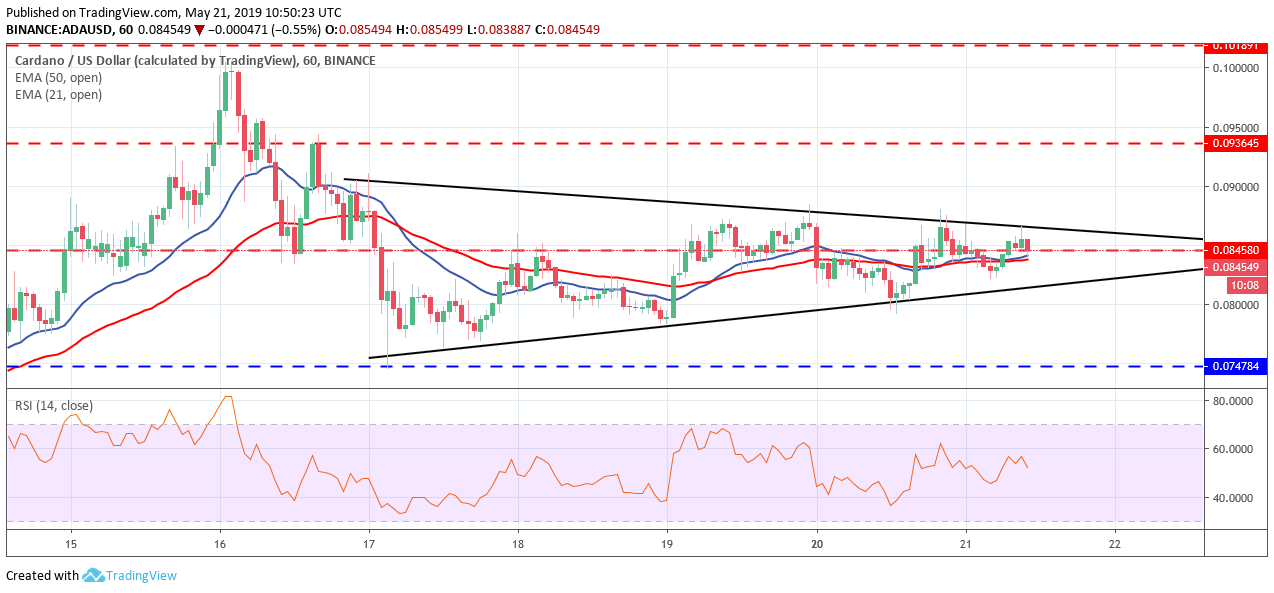
On the Medium-term outlook, ADA is on the ranging mode. The Bears bottomed the coin at $0.07 on May 17. The Bulls pushed up the price but could not break up the $0.08 level. The price returned to the previous low at $0.07. It continuously moves up and down within the range. The price movement has resulted in the formation of a symmetrical triangle in the 1-hour chart.
The two EMAs are interlocked to each other with the ADA price moving over and around the two EMAs; which indicates that consolidation is ongoing in the Cardano market. However, Relative Strength Index period 14 is below 60 levels and the signal line points up to connotes buy signal.
The post Price Analysis: ADA/USD Consolidating At $0.08, Bulls Await Phenomenal Breakout appeared first on ZyCrypto.