Stellar Lumens (XLM) Price Analysis – June 3
Resistance levels: $0.14, $0.16, $0.18
Support level: $0.11, $0.09, $0.07
XLM/USD Price Long-term Trend: Ranging
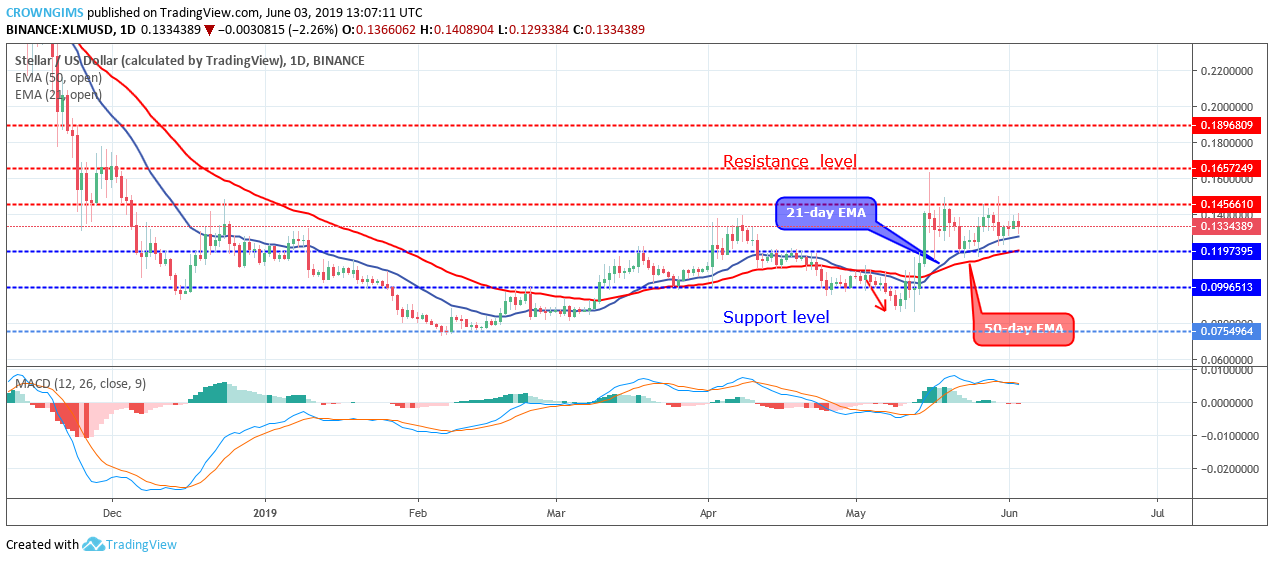
On the long-term outlook, XLM price is ranging. The crypto is range-bound within the resistance level of $0.14 and the support level of $0.11 for more than two weeks. The Bulls lost momentum when the price was pushed to the resistance level of $0.16 on May 16. The Bears prevailed and the Bullish candle turned to inverted pin bar.
XLM price decreased further towards $0.11 support level. The Bulls equally opposed the bearish movement and the price was pushed back into the range. On May 30, the Bulls made an attempt to break up the $0.14 level but the Bears rejected the move. As at the moment, the bullish and bearish momentum has not gone beyond the range of $0.11 to $0.14 levels.
Although the 21 periods EMA has crossed 50 periods EMA upside as a sign of bullish movement, the XLM price is still hovering over the two EMA which connotes Buyers and sellers low momentum in the XLM market.
The Moving Average Convergence and Divergence period 12 with its histogram parallel to zero level and the signal lines interlocked to each other, horizontally flat showing no specific direction; this is an indication of a sideways movement
Radical fundamental events may be required to make the coin rally. The Bulls will have to double their pressure in order to break up the $0.14 resistance level.
XLM/USD Price Medium-term Trend: Ranging
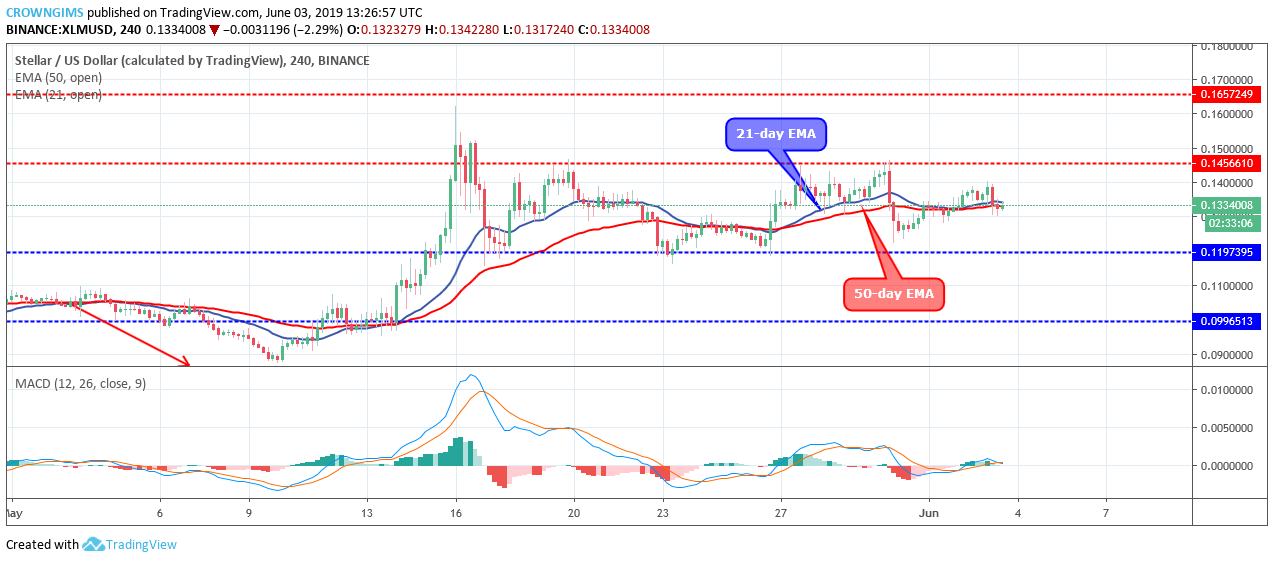
On the medium-term trend, the XLM price is ranging. The bulls’ momentum and the Bears’ momentum are equal in the XLM market and this resulted in the sideways movement of the XLM price within the $0.14 and $0.11 levels.
In case the bearish candle produce by the Bears can penetrate the support level of $0.11 and close below the level, then XLM price may touch $0.09 level.
The XLM price is trading over and around the 21 periods EMA and 50 periods EMA with the two EMA horizontally flat on the 4- hour chart which indicates that consolidation is ongoing.
The post Stellar Lumens (XLM) Price Analysis – June 3 appeared first on ZyCrypto.