Bitcoin Price Takes A Deep Dive But Strives To Stay Above $10k. What’s Next For Bitcoin?

Bitcoin has dipped in the past few hours, placing the virtual asset’s price slightly above $10,000. The daily chart, technical indicators, and market sentiment are not currently in favor of Bitcoin. A combination of all these reveals that soon, Bitcoin could tank below the $10,000 zone it has held onto so dearly for the past few days.
Bitcoin Struggles to Maintain $10,000 Price Level
Bitcoin’s price, as of press time, is $10,096, which is a 4.96% decline in the past 24 hours. The percentage dip in price is even lower when consideration is given to its value over 24 hours ago. For instance, at 00.04 UTC +01:00, which is the start of today, Bitcoin was valued at $10,823. A comparison between its price earlier today and its current price shows that Bitcoin dumped by 6.18% within a few hours.
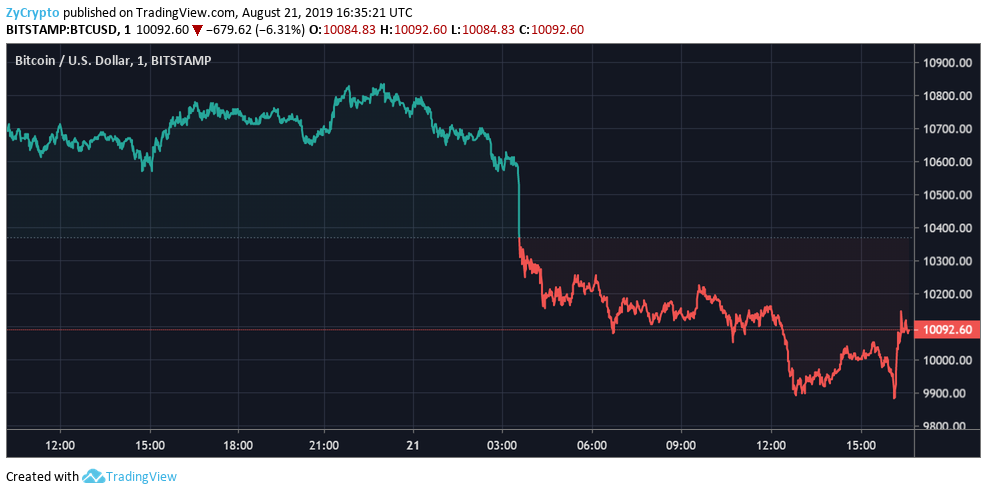
On the other hand, the gains which were recorded last week have tanked with the most recent decline. As of August 20, 2019, Bitcoin had surged to a day-high of $10,947. This increment had restored hope that it could spike higher after falling from its $11,000 price level on August 13, 2019.
Bitcoin’s 4-hour Chart and Technical Indicators Show Bearish Sign
In the same vein, the Bitcoin 4-hour chart is not saying something different, and neither are technical indicators. Despite its consolidation in the past two days, when Bitcoin reversed from its $10,800 price level, there was also a retracement from the horizontal triangle’s 50-days moving average line and 4-hour descending trend-line.
Also, Bitcoin seems to be making lower highs instead of higher lows, which is a bearish pattern. The $10,800 zone has been critical resistance for it; however, its support currently lies around the $9,800 and $10,150 region. Bitcoin’s short term chart is also outlining a 100-days moving average line and 4-hour ascending trend-line.
Bitcoin Could Retrace to $9,600 and $9,300 Levels or Even Lower
If either of this support ($9,800 and $10,150 ) fails to hold, then there’s no saying that it won’t retrace further to the $9,600 and $9,300 zones. Thus at the moment, there are concerns if the asset can maintain its $9950 to $10,000 support which had been evident in most of August or it could take a deep dive down to the $8800 and $8500 levels.
The crypto community have also taken a look at these charts and noted Bitcoin’s declining volume and the rejected retrace at the 50% Fibonacci extension level. From their perspective, this could be a repeat of November 2018. Others are, however, of the opinion that it is yet another time to buy the dip because the next surge might be the much-awaited bull run.
The post Bitcoin Price Takes A Deep Dive But Strives To Stay Above $10k. What’s Next For Bitcoin? appeared first on ZyCrypto.