Cryptocurrency and ICO Market Analysis [February 12-18, 2018]
Information as of February 18, 2018
This report was created by:
- Professor Dmitrii Kornilov, Doctor of Economics, Member of the Russian Academy of Natural Sciences, and Leading Analyst at ICOBox;
- Dima Zaitsev, PhD in Economics, Head of International Public Relations and Business Analytics Department Chief at ICOBox;
- Nick Evdokimov, Co-Founder of ICOBox;
- Mike Raitsyn, Co-Founder of ICOBox;
- Anar Babaev, Co-Founder of ICOBox;
- Daria Generalova, Co-Founder of ICOBox;
This report presents data on the cryptocurrency and ICO market changes during 2017-2018. Special emphasis has been placed on an analysis of the changes that took place in February 2018, including over the last week (February 12-18, 2018).
1. General cryptocurrency and digital assets market analysis (by week, month, quarter). Market trends.
1.1 General cryptocurrency and digital assets market analysis (by week, month).
Table 1.1. Trends in capitalization of the cryptocurrency market and main cryptocurrencies from January 1, 2017, to February 18, 2018*
| Parameter | 1-Jan-18 | 1-Feb-18 | MoM, % | 4-Feb-18 | DoD, % | 11-Feb-18 | DoD, % | 18- Feb-18 | DoD, % | |
| 1 | Total market capitalization, USD billion | 612.9 | 517.2 | -15.6% | 447.2 | -13.5% | 422.2 | -5.6% | 513.8 | 21.7% |
| 2 | Altcoin market capitalization, USD billion | 376.2 | 344.8 | -8.3% | 292.7 | -15.1% | 277.0 | -5.3% | 326.1 | 17.7% |
| Altcoin dominance, % | 61.4% | 66.7% | – | 65.4% | – | 65.6% | – | 63.5% | – | |
| 3 | Bitcoin price, $ | 14 112.2 | 10 237.3 | -27.5% | 9 175.7 | -10.4% | 8 616.1 | -6.1% | 11 123.4 | 29.1% |
| Bitcoin market capitalization, USD billion | 236.7 | 172.4 | -27.2% | 154.6 | -10.3% | 145.2 | -6.0% | 187.7 | 29.2% | |
| Bitcoin dominance, % | 38.6% | 33.3% | – | 34.6% | – | 34.4% | – | 36.5% | – | |
| 4 | Ethereum price, $ | 755.8 | 1 119.4 | 48.1% | 964.7 | -13.8% | 859.3 | -10.9% | 973.4 | 13.3% |
| Ethereum market capitalization, USD billion | 73.1 | 109 | 49.1% | 94 | -13.8% | 83.8 | -10.8% | 95.1 | 13.4% | |
| Ethereum dominance, % | 11.9% | 21.1% | – | 21% | – | 19.9% | – | 18.5% | – | |
| 5 | Bitcoin Cash price, $ | 2 534.8 | 1 491.1 | -41.2% | 1 273.2 | -14.6% | 1 255.6 | -1.4% | 1 552.1 | 23.6% |
| Bitcoin Cash market capitalization, USD billion | 42.8 | 25.3 | -41% | 21.6 | -14.6% | 21.3 | -1.3% | 26.3 | 23.7% | |
| Bitcoin Cash dominance, % | 7% | 4.9% | – | 4.8% | – | 5.0% | – | 5.1% | – | |
| 6 | Litecoin price, $ | 231.7 | 163.7 | -29.3% | 160.4 | -2% | 155.4 | -3.1% | 230.5 | 48.3% |
| Litecoin market capitalization, USD billion | 12.6 | 9 | -28.8% | 8.8 | -1.9% | 8.6 | -2.9% | 12.7 | 48.6% | |
| Litecoin dominance, % | 2.1% | 1.7% | – | 2% | – | 2.0% | – | 2.5% | – | |
| 7 | Smith + Crown Index | 27 543 | 24 709 | -10.3% | 22 262 | -9.9% | 19 894 | -10.6% | 24 799 | 24.7% |
| 8 | Volume (24h) 4 crypto, USD billion | 15.7 | 17.3 | 10.2% | 11.9 | -31.1% | 11.8 | -0.9% | 13.3 | 12.8% |
| Market cap 4 crypto, USD billion | 441.6 | 351.6 | -20.4% | 305.7 | -13% | 292.0 | -4.5% | 356.1 | 22.0% | |
| ZAK-4 Crypto index | 3.6% | 4.9% | – | 3.9% | – | 4.0% | – | 3.7% | – | |
| 4 crypto dominance, % | 72% | 68% | – | 68.4% | – | 69.2% | – | 69.3% | – | |
| 9 | Volume (24h) 8 crypto, USD billion | 17.2 | 19 | 10.2% | 14.2 | -25.3% | 13.0 | -8.4% | 14.9 | 14.6% |
| Market cap 8 crypto, USD billion | 488.6 | 393.4 | -19.5% | 341.6 | -13.2% | 325.7 | -4.6% | 397.4 | 22.0% | |
| ZAK-8 Crypto index | 3.5% | 4.8% | – | 4.1% | – | 4.0% | – | 3.7% | – | |
| 8 crypto dominance, % | 79.7% | 76.1% | – | 76.4% | – | 77.2% | – | 77.3% | – |
* Data as of February 18, 2018 (all figures calculated at 03:00 UTC)
** Since December 1, 2017, the ZAK-4 index has been calculated using the cryptocurrencies Bitcoin, Ethereum, Ripple, and Bitcoin Cash.
*** When calculating the ZAK-8 index, the cryptocurrencies with the largest capitalization are used. At present (February 18, 2018), the cryptocurrencies Bitcoin, Ethereum, Ripple, Bitcoin Cash, Cardano, Litecoin, Stellar, and NEO are used.
Data source: coinmarketcap.com, https://www.smithandcrown.com
Last week (February 12-18, 2018) was characterized by relatively modest growth in cryptocurrency market capitalization from $422.2 to $513.8 billion, i.e. by 21.7% (03:00 UTC).
The Smith + Crown Index for the week increased from 19,894 to 24,799.
The dominance of the four and eight largest cryptocurrencies as of February 18, 2018, equaled 69.3% and 77.3%, respectively, with bitcoin dominance equaling 36.5% (see Table 1.1).
Figure 1. Cryptocurrency market capitalization, February 11-18, 2018
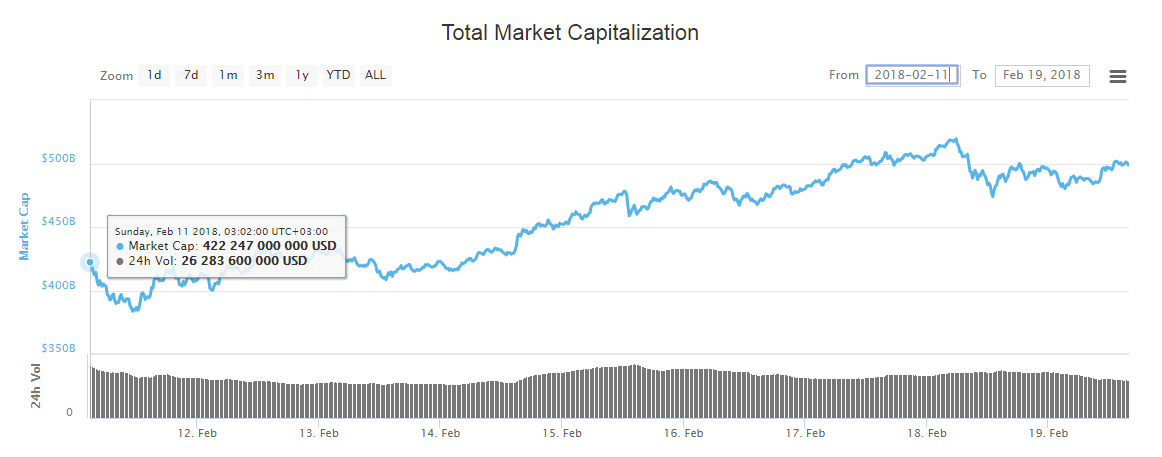
Date source: coinmarketcap.com
Last week (February 12-18, 2018) total cryptocurrency market capitalization grew by approximately $100 billion, resulting in an increase in the prices of 447 of the top 500 cryptocurrencies and digital assets.
Over the past week the number of cryptocurrencies with a capitalization of more than $1 billion increased from 24 to 29, with the price of all of them increasing over this period. The price of most cryptocurrencies increased over the past week by 10-25%, which is completely understandable and related to overall market trends.
The coins and tokens from the top 500 that demonstrated the largest growth in prices are given in fig. 2.
The growth and fall of cryptocurrency prices over the past week (February 12-18, 2018)
The prices of some cryptocurrencies may fluctuate from -50% to +50% over the course of a single day. Therefore, when analyzing cryptocurrency price trends, it is advisable to use their average daily amounts on various cryptoexchanges.
Below we consider the top 10 cryptocurrencies that showed the largest change in price over the past week (fig. 2-3). In this regard, only those coins and tokens included in the top 500 in terms of market capitalization (according to the data of coinmarketcap.com) were considered.
Figure 2. Largest growth in prices over the last week
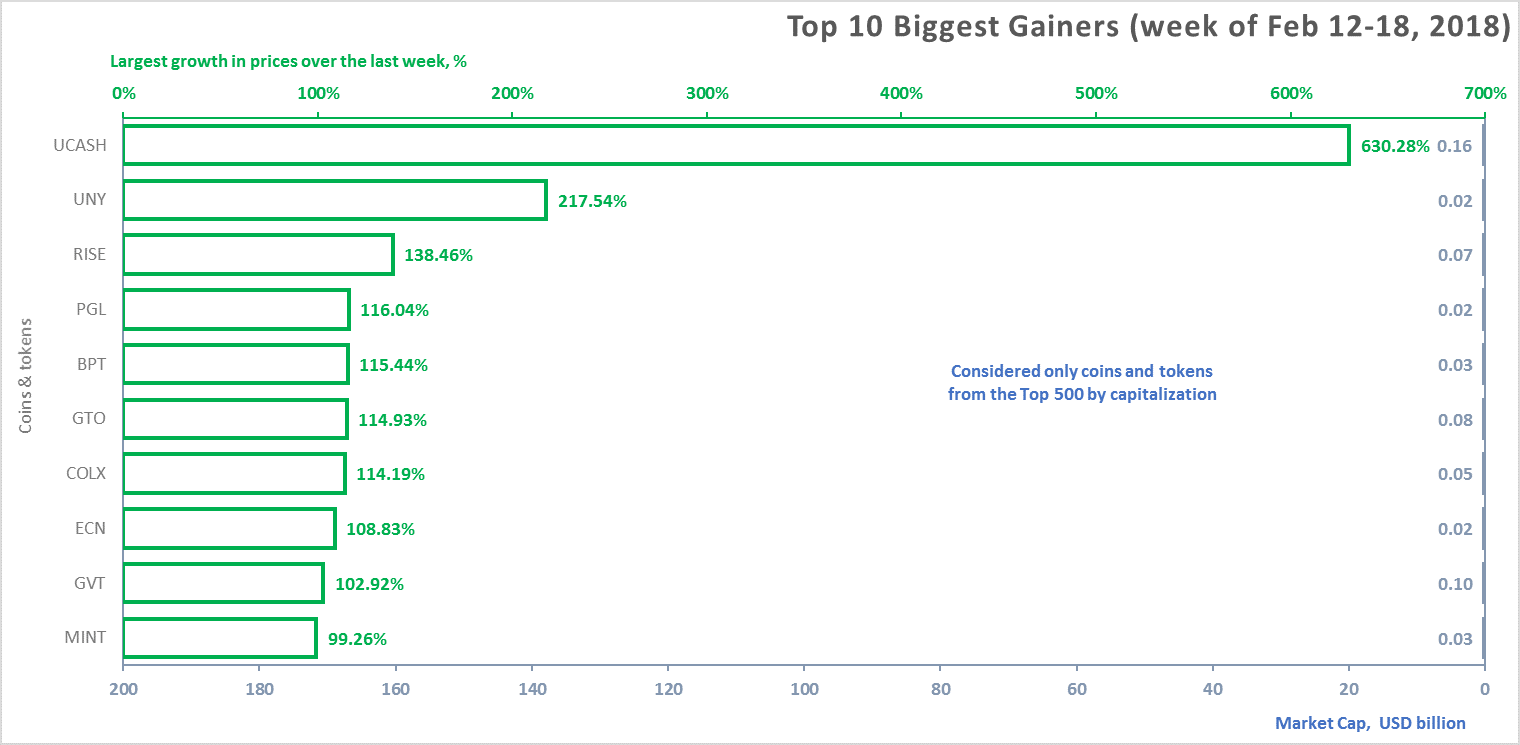
Data source: coinmarketcap.com
The change in price was calculated based on average daily data.
Tables 1.2 and 1.3 show the possible factors or events that could have influenced the fluctuation in prices for certain cryptocurrencies. Table 1.4 shows the possible factors or events that could have influenced the cryptocurrency market in general.
Table 1.2. Factors or events that could have led to a growth in cryptocurrency prices over the past week
| № | Coins and tokens | Symbol | Price growth over the week, % | Average price in $ on Feb 18, 2018 | Market capitalization, USD billion | Factors or events that could have led to a growth in cryptocurrency prices over the past week |
| 1 | U.CASH | UCASH | 630.28% | $0.105180 | 0.16 | The U.CASH token is used as the means of payment on the exchange of the same name. The U.CASH exchange is based on blockchain technology, and combines a cryptocurrency exchange and an exchange for fiat currencies. Over the past week its token increased in price by more than 600%, reaching a capitalization of $160 million. The token is traded on two relatively small exchanges, BTCAlpha and C2CX, with 24-hour trading volumes ranging from $150,000 to $4.5 million over the course of the week. The token was listed on the exchanges on February 9, and shows the high volatility characteristic for new tokens. For example, on February 11 capitalization equaled around $8-11 million, before a sharp jump on February 12 to $325 million, a subsequent fall by February 15 back to $43 million, and then another climb to $200 million. (https://coinmarketcap.com/currencies/ucash/#charts). |
| 2 | Unity Ingot | UNY | 217.54% | $0.103053 | 0.02 | On February 8, the Unity Ingot token began its growth after its recent listing on two relatively small exchanges, LiveCoin and C-CEX. The token is marked by high volatility, as is the case with all tokens that recently commenced trading on exchanges, but since February 8 it has shown uninterrupted growth without the announcement of any important news items. |
| 3 | Rise | RISE | 138.46% | $0.621890 | 0.07 | Rise was taken off of two major exchanges, UpBit and Bittrex, on February 11, and is now only available on small exchanges such as YoBit and LiteBit.eu, which had a 24-hour trading volume of only $6,500 on February 18. Although its delisting is very bad news, its price has begun to grow since that time due to the fact that the token is now only available on very small cryptoexchanges with very small trading volumes. |
| 4 | Prospectors Gold | PGL | 116.04% | $0.258446 | 0.02 | This token has practically no trading volume, with trading taking place on only one exchange https://coinmarketcap.com/exchanges/coinexchange/. Therefore, this volatility could be the result of even one buyer appearing on the exchange. |
| 5 | Blockport | BPT | 115.44% | $0.578795 | 0.03 | Blockport is a very young token that has been traded since January 24, and has the instability characteristic of such tokens. The growth was caused by new exchange listings, in particular on the large KuCoin exchange https://twitter.com/blockportio/status/964462444419735553. |
| 6 | Gifto | GTO | 114.93% | $0.537578 | 0.08 | Gifto is a platform for gifts and creating greeting cards. The growth was caused by Valentine’s Day on February 14 and the resulting increase in demand for gifts. |
| 7 | ColossusCoinXT | COLX | 114.19% | $0.004880 | 0.05 | This token has a relatively small trading volume of around $50,000-70,000 (https://coinmarketcap.com/currencies/colossuscoinxt/#charts), and a 100% growth over a week is nothing unusual for such tokens. |
| 8 | E-coin | ECN | 108.83% | $62.40 | 0.02 | The Community and Twitter accounts of this project are not very active, and the level of 24-hour trading volume is also insignificant (around $100,000-170,000). The instability may have been caused by simply market speculation. |
| 9 | Genesis Vision | GVT | 102.92% | $27.64 | 0.10 | GVT and MINT are tokens that have been traded since January 20 on several exchanges, and this volatility is normal for the early stages of trading. |
| 10 | Mintcoin | MINT | 99.26% | $0.001130 | 0.03 |
Fairly high growth in prices was also seen last week for the popular cryptocurrencies ZClassic (ZCL) – 90%, Verge (XVG) – 59%, OmiseGO (OMG), Ethereum Classic (ETC) and Litecoin – around 50%. ZClassic is a fork of Zcash, a token that ensures maximum confidentiality. Over the course of two weeks in late December-early January, the price of ZCL skyrocketed by more than a factor of 20, which many believed was the result of currency pumping. The furor surrounding Litecoin can be partially explained by the hard fork that led to the appearance on February 18 of the new cryptocurrency Litecoin Cash (LCC), which is already being traded on YoBit.
The only coins from the Top 100 to show a fall in price over the week were SmartCash (-6.27%) and Kyber Network (-9.39%), while the price of 53 coins and tokens from the Top 500 dropped.
Figure 3. Largest fall in prices over the past week
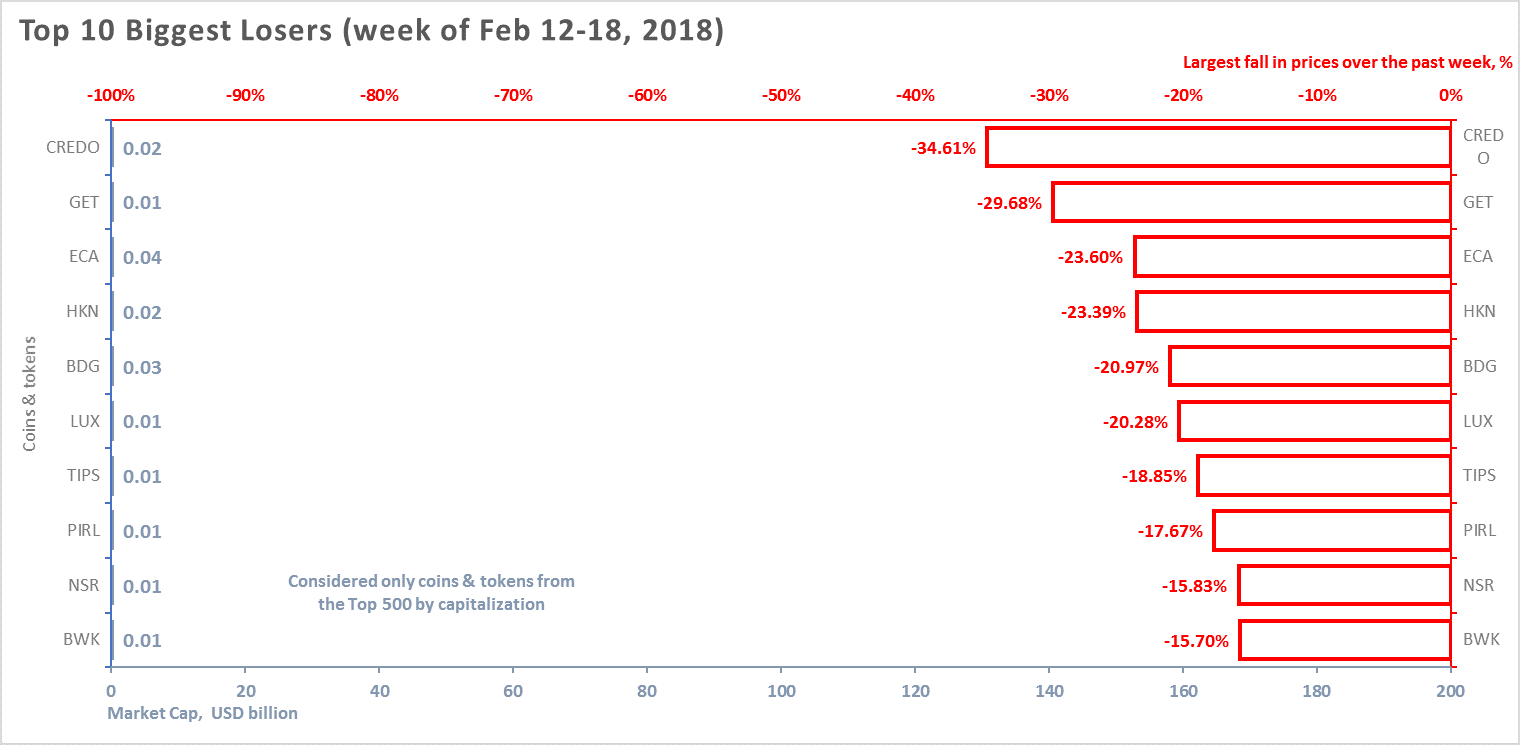
Table 1.3. Factors or events that could have led to a fall in cryptocurrency prices over the past week
| № | Coins and tokens | Symbol | Fall in price over the week, % | Average price in $ on Feb 18, 2018 | Market capitalization, USD billion | Factors or events that could have led to a fall in cryptocurrency prices over the past week |
| 1 | Credo | CREDO | -34.61% | $0.030354 | 0.02 | Credo, Get Protocol, FedoraCoin and NuShares have very small trading volumes, with the largest being $45,000 for NuShares on February 14 (https://coinmarketcap.com/currencies/nushares/), and a change in prices of up to 35% over a week can be written off to volatility.
Pirl, Hacken and BitDegree have only been traded on exchanges for a very short time (for example, Pirl has only been traded for a week), and instability, often including a negative trend for new tokens, is typical for tokens that have just been listed on exchanges. Electra reached its peak of $0.0081 on February 7, but since then has undergone a strong downward adjustment, which continues to this day. LuxCoin and Bulwark fell by 20% and 15.7%, respectively, over the week, which is not a major incident in the crypto industry and may have been caused simply by volatility. |
| 2 | GET Protocol | GET | -29.68% | $0.960892 | 0.01 | |
| 3 | Electra | ECA | -23.60% | $0.001676 | 0.04 | |
| 4 | Hacken | HKN | -23.39% | $4.08 | 0.02 | |
| 5 | BitDegree | BDG | -20.97% | $0.084409 | 0.03 | |
| 6 | LUXCoin | LUX | -20.28% | $11.75 | 0.01 | |
| 7 | FedoraCoin | TIPS | -18.85% | $0.000026 | 0.01 | |
| 8 | Pirl | PIRL | -17.67% | $1.06 | 0.01 | |
| 9 | NuShares | NSR | -15.83% | $0.005061 | 0.01 | |
| 10 | Bulwark | BWK | -15.70% | $3.89 | 0.01 |
Table 1.4 shows events that took place from February 12-18, 2018, and had an impact on both the prices of the dominant cryptocurrencies and the market in general, with an indication of their nature and type of impact.
Table 1.4. Key events of the week having an influence on cryptocurrency prices, February 12-18, 2018
| № | Factors and events
(link to source) |
Date of news | Date of event* | Description | Nature of impact | Type of impact |
| 1. | Dubai Trader Gets First Mideast License in Cryptocurrencies [source: Bloomberg] | February 13, 2018 | February 13, 2018 | This news shows that the government of yet another country is reacting positively to the advancement of the crypto industry. This is the first official permit for trading in cryptocurrencies in the Middle East. | Market ⇑
|
Favorable |
| 2. | Major Cryptocurrencies on the Rise as CFTC Set to Create Crypto and DLT Committees [source: Coinspeaker] | February 15, 2018 | February 15, 2018 | The regulator gave the crypto industry the opportunity to self-regulate and create its own associations for monitoring activity. This is good news for the industry, since the other alternatives to the decision adopted by CFTC stipulated much stricter measures. | Market ⇑ | Favorable |
| 3. | Bank of America Has Filed More Cryptocurrency Patents Than Any Other Company [source: Bitcoin.com] | February 16, 2018 | February 16, 2018 | Bank of America turned out to be in first place in terms of the number of patent applications submitted for blockchain over companies such as Alibaba, IBM and Mastercard. This interest in the blockchain industry by a large American bank is a positive sign for the entire market and suggests that major players in the finance industry are interested in the technology. | Market ⇑ | Favorable |
* Event already took place
To analyze trading activity on cryptocurrency exchanges, the ZAK-n Crypto index is calculated (see the Glossary). The values of the ZAK-4 Crypto and ZAK-8 Crypto indices are presented in Tables 1.1, 1.5.a, and 1.5.b. For example, on February 6, 2018, the 24-hour trading volume (Volume 24h) for the four dominant cryptocurrencies (Bitcoin, Ethereum, Bitcoin Cash, and Ripple) exceeded $23 billion (Table 1.5.a). The value of the ZAK-4 Crypto equaled 10.3%, which attests to the extremely high liquidity and market dynamism of the dominant cryptocurrencies. The value of the index increased during the downward adjustment of the cryptocurrency market (February 6, 2018), i.e. the daily turnover of cryptocurrencies exceeded 10% of their market capitalization.
Table 1.5.a. Daily ZAK-4 Crypto index calculation (from February 1, 2018, to February 18, 2018)
| Crypto | Bitcoin (BTC) | Ethereum (ETH) | Bitcoin Cash (BCH) | Ripple (XRP) | 4 Crypto | ||||||||||
| Price Open | Volume (24h) | Market cap | Price Open | Volume (24h) | Market cap | Price Open | Volume (24h) | Market cap | Price Open | Volume (24h) | Market cap | Volume (24h) 4 crypto | Market cap 4 crypto | ZAK-4 Crypto index | |
| Date | $ | USD billion | USD billion | $ | USD billion | USD billion | $ | USD billion | USD billion | $ | USD billion | USD billion | USD billion | USD billion | % |
| Feb 18, 2018 | 11 123 | 8.7 | 187.7 | 973 | 2.6 | 95.1 | 1 552 | 0.9 | 26.3 | 1.20 | 1.1 | 47.0 | 13.3 | 356.1 | 3.7% |
| Feb 17, 2018 | 10 208 | 8.7 | 172.2 | 945 | 2.5 | 92.3 | 1 548 | 0.6 | 26.3 | 1.14 | 1.2 | 44.4 | 13.0 | 335.1 | 3.9% |
| Feb 16, 2018 | 10 136 | 7.3 | 171.0 | 935 | 2.4 | 91.3 | 1 373 | 1.0 | 23.3 | 1.14 | 0.6 | 44.7 | 11.2 | 330.2 | 3.4% |
| Feb 15, 2018 | 9 488 | 9.1 | 160.0 | 924 | 2.9 | 90.2 | 1 359 | 0.5 | 23.1 | 1.14 | 1.2 | 44.4 | 13.7 | 317.7 | 4.3% |
| Feb 14, 2018 | 8 600 | 7.9 | 145.0 | 844 | 2.8 | 82.4 | 1 229 | 0.6 | 20.9 | 1.03 | 1.5 | 40.0 | 12.8 | 288.3 | 4.4% |
| Feb 13, 2018 | 8 927 | 5.7 | 150.5 | 869 | 2.1 | 84.8 | 1 285 | 0.4 | 21.8 | 1.08 | 0.9 | 42.1 | 9.1 | 299.3 | 3.1% |
| Feb 12, 2018 | 8 141 | 6.3 | 137.3 | 818 | 2.2 | 79.8 | 1 222 | 0.5 | 20.7 | 1.01 | 1.8 | 39.3 | 10.7 | 277.0 | 3.9% |
| Feb 11, 2018 | 8 616 | 6.1 | 145.2 | 859 | 2.5 | 83.8 | 1 256 | 0.7 | 21.3 | 1.07 | 2.6 | 41.6 | 11.8 | 292.0 | 4.0% |
| Feb 10, 2018 | 8 720 | 7.8 | 147.0 | 882 | 2.9 | 86.1 | 1 312 | 0.7 | 22.2 | 0.95 | 4.7 | 37.0 | 16.1 | 292.2 | 5.5% |
| Feb 9, 2018 | 8 272 | 6.8 | 139.4 | 818 | 2.5 | 79.8 | 1 274 | 1.1 | 21.6 | 0.80 | 1.7 | 31.1 | 12.1 | 271.9 | 4.5% |
| Feb 8, 2018 | 7 638 | 9.3 | 128.7 | 756 | 3.7 | 73.7 | 952 | 2.2 | 16.1 | 0.73 | 0.9 | 28.4 | 16.2 | 247.0 | 6.6% |
| Feb 7, 2018 | 7 755 | 9.2 | 130.7 | 790 | 3.9 | 77.0 | 971 | 0.9 | 16.5 | 0.77 | 1.1 | 30.2 | 15.1 | 254.4 | 5.9% |
| Feb 6, 2018 | 7 052 | 14.0 | 118.8 | 708 | 6.5 | 69.0 | 891 | 0.8 | 15.1 | 0.71 | 2.4 | 27.5 | 23.7 | 230.4 | 10.3% |
| Feb 5, 2018 | 8 271 | 9.3 | 139.3 | 835 | 4.3 | 81.3 | 1 160 | 0.6 | 19.7 | 0.83 | 1.3 | 32.2 | 15.4 | 272.5 | 5.7% |
| Feb 4, 2018 | 9 176 | 7.1 | 154.6 | 965 | 3.0 | 94.0 | 1 273 | 0.7 | 21.6 | 0.91 | 1.2 | 35.6 | 11.9 | 305.7 | 3.9% |
| Feb 3, 2018 | 8 852 | 7.3 | 149.1 | 919 | 3.2 | 89.5 | 1 194 | 0.5 | 20.2 | 0.89 | 2.0 | 34.8 | 12.9 | 293.6 | 4.4% |
| Feb 2, 2018 | 9 142 | 12.7 | 154.0 | 1 036 | 6.7 | 100.8 | 1 273 | 0.9 | 21.6 | 0.96 | 3.5 | 37.5 | 23.9 | 313.8 | 7.6% |
| Feb 1, 2018 | 10 237 | 10.0 | 172.4 | 1 119 | 5.3 | 109.0 | 1 491 | 0.7 | 25.3 | 1.16 | 1.4 | 45.0 | 17.3 | 351.6 | 4.9% |
* Data as of February 18, 2018, 00:00 UTC
** Data source: coinmarketcap.com
The 24-hour trading volumes (Volume 24h) for the eight dominant cryptocurrencies (Bitcoin, Ethereum, Bitcoin Cash, Ripple, Litecoin, Stellar, NEO, and Cardano) equaled $14.9 billion at the end of last week (Table 1.5.b), i.e. 3.7% of their market capitalization. The ZAK-4 Crypto and ZAK-8 Crypto indices are considered in more detail in Tables 1.5.a and 1.5.b.
Table 1.5.b. Daily ZAK-8 Crypto index calculation (continuation of Table 1.5.а)
| Crypto | Stellar (XLM) | Cardano (ADA) | NEO (NEO) | Litecoin (LTC) | 8 Crypto | ||||||||||
| Price Open | Volume (24h) | Market cap | Price Open | Volume (24h) | Market cap | Price Open | Volume (24h) | Market cap | Price Open | Volume (24h) | Market cap | Volume (24h) | Market cap | ZAK-8 Crypto index | |
| Date | $ | USD billion | USD billion | $ | USD billion | USD billion | $ | USD billion | USD billion | $ | USD billion | USD billion | USD billion | USD billion | % |
| Feb 18, 2018 | 0.48 | 0.07 | 8.8 | 0.418 | 0.3 | 10.8 | 136.4 | 0.21 | 8.9 | 231 | 1.0 | 12.7 | 14.9 | 397.4 | 3.7% |
| Feb 17, 2018 | 0.46 | 0.10 | 8.4 | 0.402 | 0.3 | 10.4 | 131.0 | 0.29 | 8.5 | 230 | 0.9 | 12.7 | 14.6 | 375.1 | 3.9% |
| Feb 16, 2018 | 0.45 | 0.05 | 8.3 | 0.410 | 0.2 | 10.6 | 123.0 | 0.19 | 8.0 | 226 | 1.3 | 12.5 | 12.9 | 369.6 | 3.5% |
| Feb 15, 2018 | 0.45 | 0.11 | 8.3 | 0.395 | 0.3 | 10.2 | 122.0 | 0.22 | 7.9 | 212 | 2.1 | 11.7 | 16.4 | 355.9 | 4.6% |
| Feb 14, 2018 | 0.41 | 0.19 | 7.6 | 0.374 | 0.3 | 9.7 | 110.9 | 0.23 | 7.2 | 160 | 2.4 | 8.8 | 15.9 | 321.6 | 5.0% |
| Feb 13, 2018 | 0.40 | 0.20 | 7.3 | 0.383 | 0.2 | 9.9 | 113.6 | 0.18 | 7.4 | 162 | 0.5 | 8.9 | 10.2 | 332.8 | 3.1% |
| Feb 12, 2018 | 0.37 | 0.06 | 6.9 | 0.373 | 0.2 | 9.7 | 104.2 | 0.27 | 6.8 | 150 | 0.5 | 8.3 | 11.8 | 308.6 | 3.8% |
| Feb 11, 2018 | 0.41 | 0.09 | 7.5 | 0.405 | 0.3 | 10.5 | 110.5 | 0.26 | 7.2 | 155 | 0.5 | 8.6 | 13.0 | 325.7 | 4.0% |
| Feb 10, 2018 | 0.40 | 0.23 | 7.3 | 0.387 | 1.0 | 10.0 | 117.2 | 0.36 | 7.6 | 163 | 0.6 | 9.0 | 18.2 | 326.2 | 5.6% |
| Feb 9, 2018 | 0.36 | 0.14 | 6.6 | 0.353 | 0.4 | 9.1 | 112.0 | 0.21 | 7.3 | 150 | 0.7 | 8.3 | 13.6 | 303.2 | 4.5% |
| Feb 8, 2018 | 0.34 | 0.12 | 6.4 | 0.344 | 0.3 | 8.9 | 104.1 | 0.55 | 6.8 | 138 | 0.9 | 7.6 | 18.1 | 276.6 | 6.5% |
| Feb 7, 2018 | 0.37 | 0.19 | 6.8 | 0.367 | 0.7 | 9.5 | 105.1 | 0.57 | 6.8 | 142 | 0.8 | 7.9 | 17.3 | 285.4 | 6.1% |
| Feb 6, 2018 | 0.34 | 0.52 | 6.2 | 0.331 | 1.3 | 8.6 | 84.1 | 0.66 | 5.5 | 128 | 1.1 | 7.0 | 27.3 | 257.7 | 10.6% |
| Feb 5, 2018 | 0.38 | 0.34 | 7.1 | 0.385 | 0.7 | 10.0 | 107.6 | 0.31 | 7.0 | 149 | 0.8 | 8.2 | 17.6 | 304.8 | 5.8% |
| Feb 4, 2018 | 0.43 | 0.23 | 7.9 | 0.434 | 0.8 | 11.2 | 122.2 | 0.20 | 7.9 | 160 | 1.0 | 8.8 | 14.2 | 341.6 | 4.1% |
| Feb 3, 2018 | 0.41 | 0.28 | 7.5 | 0.401 | 1.4 | 10.4 | 121.0 | 0.26 | 7.9 | 131 | 0.7 | 7.2 | 15.6 | 326.6 | 4.8% |
| Feb 2, 2018 | 0.46 | 0.40 | 8.4 | 0.419 | 1.4 | 10.9 | 125.6 | 0.55 | 8.2 | 143 | 0.8 | 7.8 | 27.1 | 349.1 | 7.8% |
| Feb 1, 2018 | 0.54 | 0.17 | 10.0 | 0.516 | 0.6 | 13.4 | 146.0 | 0.36 | 9.5 | 164 | 0.5 | 9.0 | 19.0 | 393.4 | 4.8% |
Table 1.6 gives a list of events, information on which appeared last week, which could impact both the prices of specific cryptocurrencies and the market in general.
Table 1.6. Events that could have an influence on cryptocurrency prices in the future
|
№ |
Factors and events
(link to source) |
Date of news | Date of event* | Description | Nature of impact | Type of impact |
| 1. | Adoption of New York Model? S. Korea Considers Introduction of an Approval System to Open Cryptocurrency Exchange [source: Businesskorea.co.kr] | February 12, 2018 | n/a | On the one hand, this decision shows that the South Korean government does not intend to resort to drastic measures to control the crypto industry, but, on the other hand, the new licensing system still stipulates more regulation and difficulties for cryptoexchanges. | Market | Uncertain |
1.2 Market trends
The weekly cryptocurrency and digital asset market trends from October 1, 2017, to February 18, 2018, are presented as graphs (Fig. 1.1-1.5)*.
Table 1.7. Legends and descriptions of the graphs
| Global Figures | Figure** | Description |
| Total cryptocurrency market capitalization, USD million | Fig. 1.1 | This figure shows cryptocurrency and digital asset market capitalization trends from October 1, 2017. |
| The rate of market change (as a % to the beginning of 2017) | Fig. 1.1 | This figure shows the % change in cryptocurrency and digital asset market capitalization compared to January 1, 2017. |
| Change in the market capitalization (in USD million compared to previous period) | Fig. 1.2 | This figure shows the weekly change in USD million (increase or decrease) in cryptocurrency and digital asset market capitalization from October 1, 2017. |
| The rate of market change (as a % compared to the previous period) | Fig. 1.2 | This figure shows the % of weekly change (increase or decrease) in cryptocurrency and digital asset market capitalization from October 1, 2017. |
| Number of cryptocurrencies and digital assets | Fig.1.3 | This figure shows the trends in the increase of the number of cryptocurrencies and digital assets circulating on cryptocurrency exchanges. On January 1, 2017, their number was 617, and as of February 18, 2018, this number had already reached 1,469. |
| Average market capitalization, USD million | Fig. 1.3 | This figure reflects the growth in the average cryptocurrency and digital asset market capitalization from October 1, 2017, i.e. the ratio between the market capitalization of all cryptocurrencies and digital assets and their number. |
| Forecast of total cryptocurrency market capitalization | Fig. 1.4, 1.5 | This figure shows the time trend (forecast) change in cryptocurrency and digital asset market capitalization. |
* Data as of February 18, 2018, 00:00 UTC
** The figures in the graphs below present average data for 24 hours
Data source: coinmarketcap.com
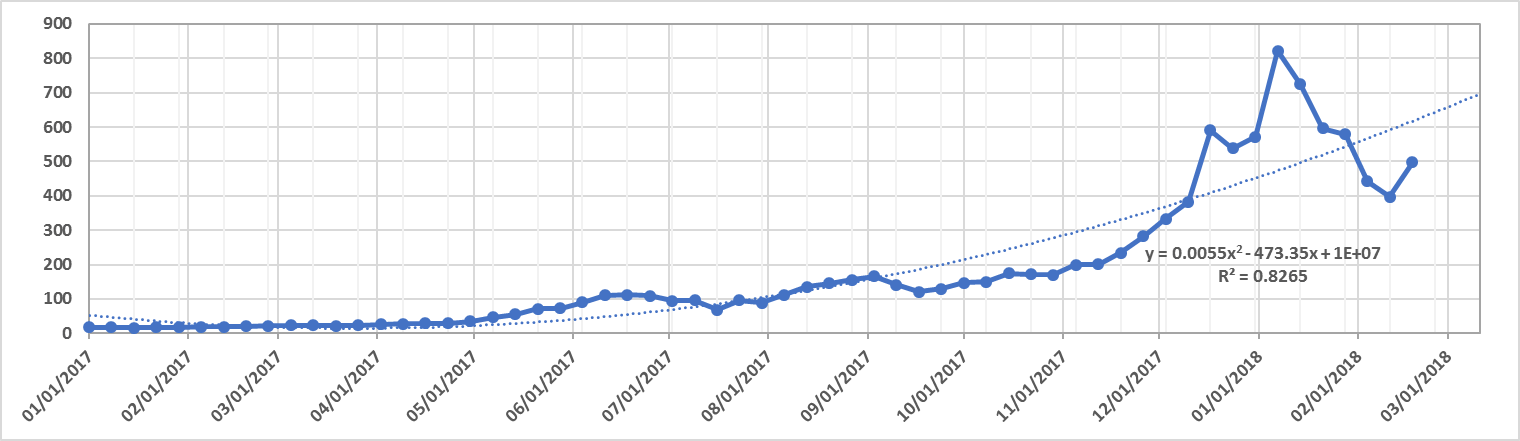
Figure 1.1. Total cryptocurrency market capitalization*
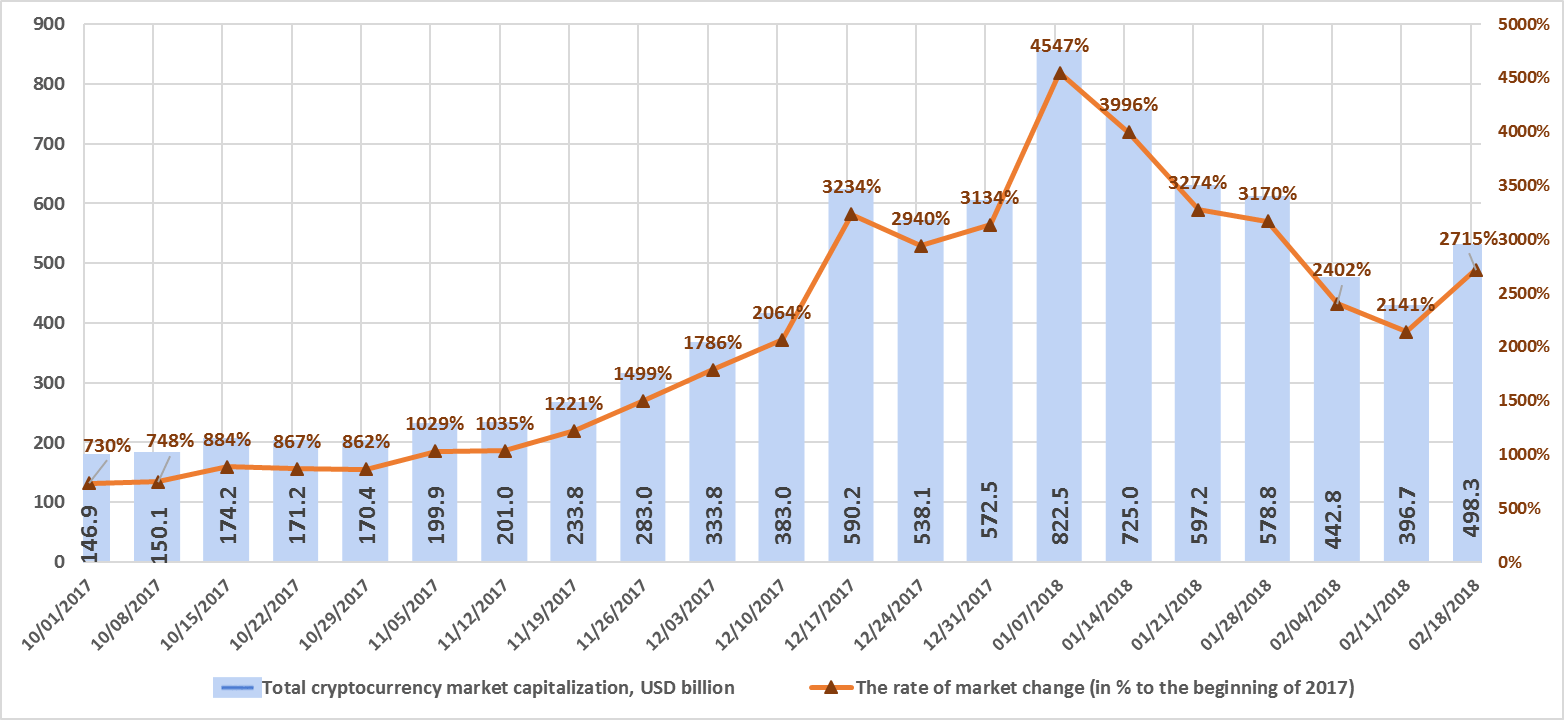
* Average daily data (according to the data of coinmarketcap.com).
Figure 1.1 shows a graph of the weekly cryptocurrency market change from October 1, 2017, to February 18, 2018. Over this period, market capitalization increased from $146.9 billion to $498.3 billion, a growth of 2,715% relative to the start of 2017. Over the first week of January 2018, total market capitalization exceeded $800 billion for the first time, but there was a downward adjustment over the next five weeks (January 8-February 11, 2018), after which the market again began to grow. Over the past week (February 12-18, 2018) capitalization increased by approximately $100 billion, from $396.7 billion to $498.3 billion (as of February 18, 2018, based on the average figures from coinmarketcap.com).
Figure 1.2. Change in market capitalization
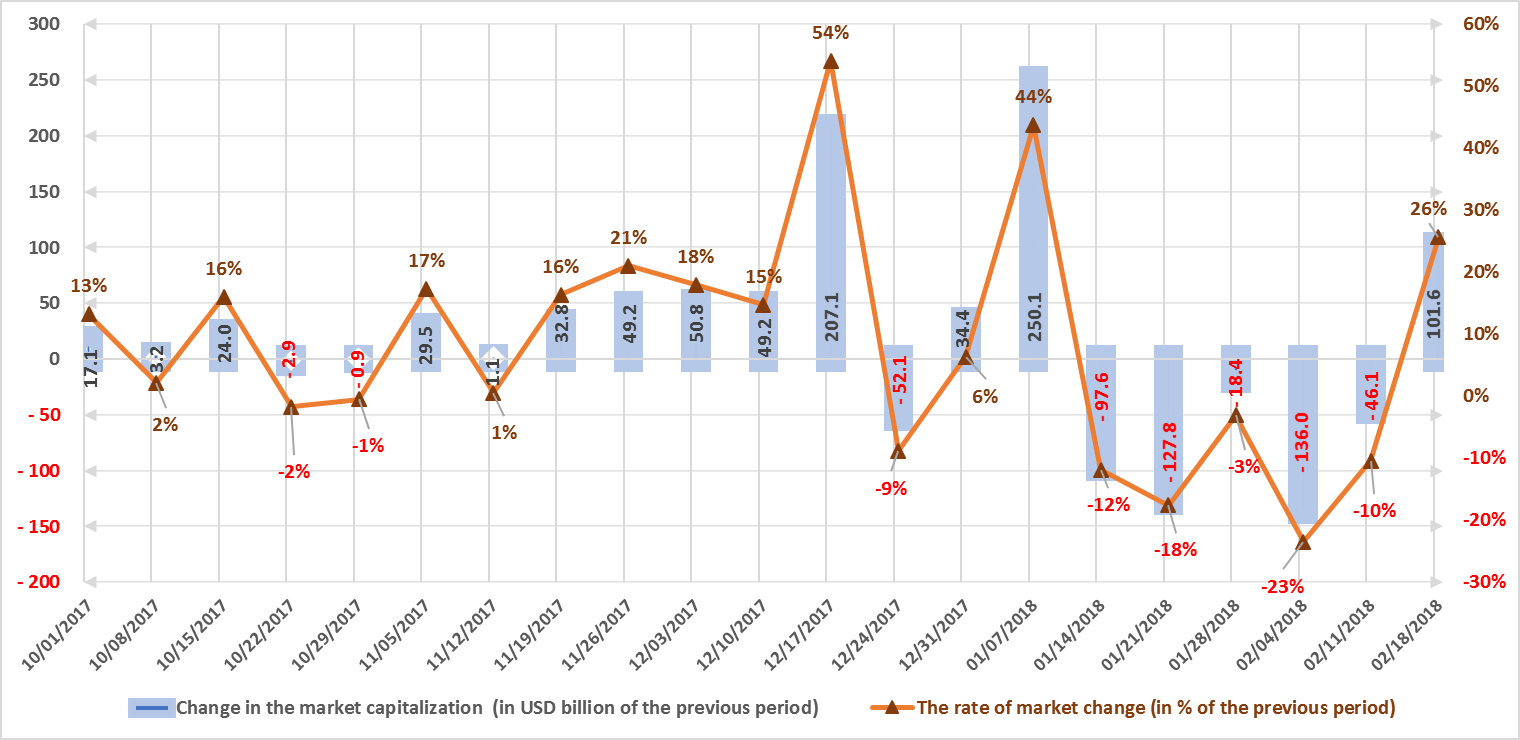
Despite the significant growth in cryptocurrency market capitalization in 2017, the market is susceptible to sudden and drastic fluctuations. The highest growth rate in Q4 2017 was around $200 billion, or 54%, during the week of December 17-24, 2017. During the first week of January, market capitalization increased by approximately $250 billion, or 44%, but over the following five weeks decreases of approximately $100 billion, $130 billion, $20 billion, $136 billion, and $46 billion, respectively, were seen. Over the past week the market grew by 26%, or $101.6 billion (with due account of average daily data, see fig. 1.2).
Figure 1.3. Number of cryptocurrencies and digital assets
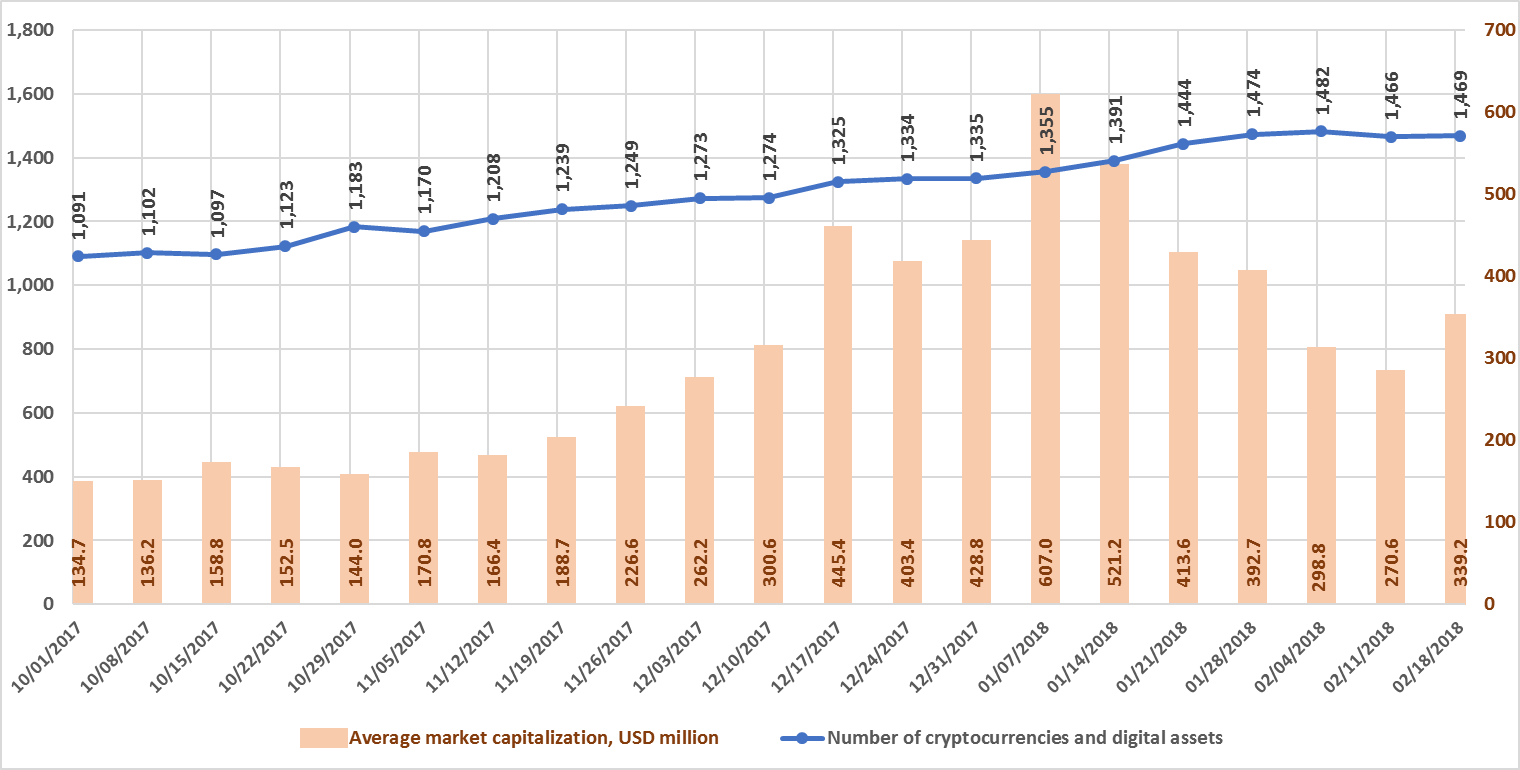
Data source: coinmarketcap.com
Since the beginning of October, the total number of cryptocurrencies and digital assets considered when calculating market capitalization increased from 1,091 to 1,469. Over the last month, 93 new coins and tokens have appeared on coinmarketcap.com, but it should be noted that some of them are excluded (including due to the closing of the projects).
The number of cryptocurrencies and digital assets increased by 3 over the past week, from 1,466 to 1,469. In this regard, their average capitalization increased from $270.6 million to $339.2 million.
Figures 1.4 and 1.5. Forecast of total cryptocurrency market capitalization
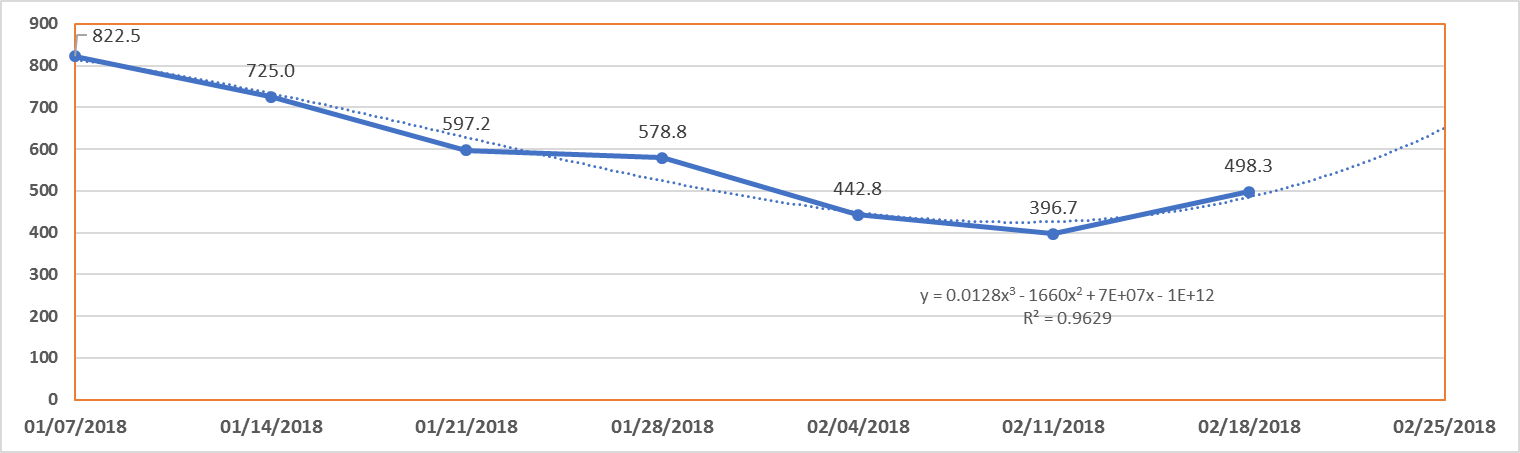
The previous article published last week correctly forecast the switch on the cryptocurrency market to a “bear” market trend. The lengthy fall (five weeks in a row) was replaced by growth. During the period of downward adjustment, the market fell by 50%, but last week average growth equaled 20-25%. This week (February 12-18, 2018) brought more positive than negative news for the cryptocurrency market. No major fluctuations in the cryptocurrency market were seen on February 16, the Chinese New Year. If there are no adverse events next week, the continued recovery of the cryptocurrency market can be expected.
2. General analysis of the ICO market (by week, month).
2.1 Brief overview of ICO market trends
1. ‘Biggest ICO Ever’: Telegram Raises $850M for Its TON Blockchain Development. [source: Coinspeaker]
2. FINMA Publishes ICO Guidelines. [source: Finma.ch]
Finma categorizes ICOs into three types: payment, utility, and asset.
The first category of ICOs includes all cryptocurrencies (coins). For example, all digital currencies such as bitcoin, litecoin, ether, and others are considered coins.
The second category (utility) includes those ICOs, the tokens of which grant access rights to something or allow their holder to purchase services or service units.
The third category (asset) includes so-called security (investment) tokens, which are similar to the shares in a company, i.e. dividends and interest can be paid on them or they grant the right to income from a project.
In particular, if a token does not pass the Howey Test, it should be considered an investment (security) token or a sort of share. In this case, the token issue might fall under the effect of securities legislation (for example, under the purview of the US Securities and Exchange Commission in the USA).
Table 2.1 shows the development trends on the ICO market since 2017. Only popular and/or successfully completed ICOs (i.e. ICOs which managed to collect the minimum declared amount of funds) and/or ICOs listed on exchanges were considered.
Table 2.1. Aggregated trends and performance indicators of past (completed) ICOs1
| Indicator | Total
2017 |
December
2017 |
January
2018 |
Feb 1-4,
2018 |
Feb 5-11,
2018 |
Feb 12-18,
2018 |
| Total amount of funds collected, USD million | 6 037.7 | 1 627.1 | 1758.1 | 363.9 | 298.8 | 296.3 |
| Number of companies that completed an ICO1 | 382 | 74 | 103 | 15 | 19 | 27 |
| Maximum collected, USD million (ICO name) | 258
(Hdac) |
258
(Hdac) |
100
(Envion) |
46
(IUNGO) |
42
(Fusion) |
39
(0chain) |
| Average collected funds, USD million | 15.8 | 22 | 17.1 | 24.3 | 15.7 | 11.0 |
Note:
1 Data source: tokendata.io, icodrops.com, icodata.io, coinschedule.com, cryptocompare.com, smithandcrown.com. For some ICOs information may currently be incomplete (for instance, the amount of funds collected).
The data for January and early February were adjusted to account for the appearance of more complete information on past ICOs. Last week (February 12-18, 2018) the amount of funds collected via ICOs equaled $296.3 million. This amount includes the results of the 27 most successful completed ICOs, with the largest amount collected equaling around $39 million (0chain ICO). The average collected funds per project equaled $11 million. More detailed information on the main ICOs, including the 27 completed over the past week, is given in Tables 2.2 and 2.3.
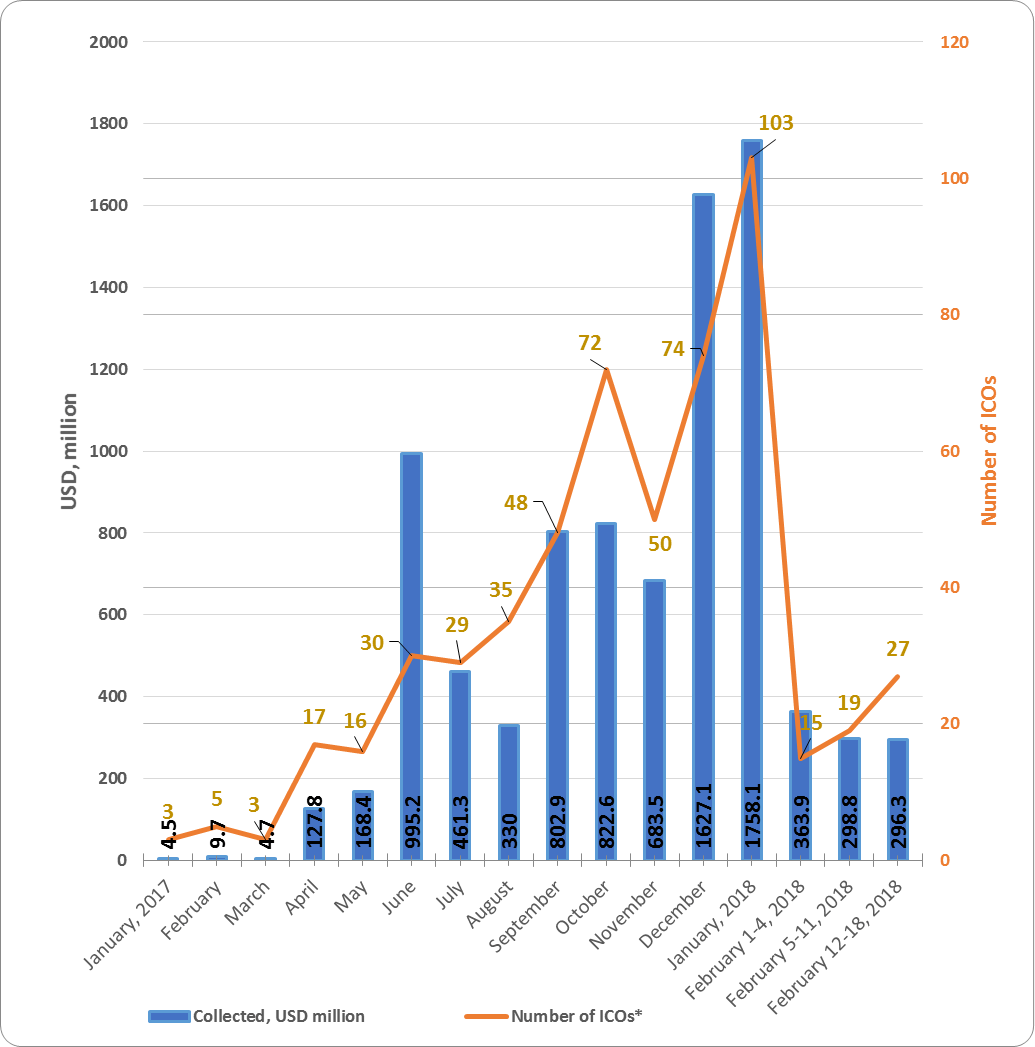
Table 2.2. Amount of funds collected and number of ICOs
| Month | Collected,
$ million |
Number of ICOs* | Average collected,
$ million |
| January 2017 | 4.5 | 3 | 1.5 |
| February | 9.7 | 5 | 1.94 |
| March | 4.7 | 3 | 1.57 |
| April | 127.8 | 17 | 7.52 |
| May | 168.4 | 16 | 10.53 |
| June | 995.2 | 30 | 33.17 |
| July | 461.3 | 29 | 15.91 |
| August | 330 | 35 | 9.43 |
| September | 730.3 | 45 | 16.23 |
| October | 794.2 | 68 | 11.7 |
| November | 683.5 | 50 | 13.7 |
| December | 1 627.1 | 74 | 22 |
| January 2018 | 1758.1 | 103 | 17.1 |
| February 1-4, 2018 | 363.9 | 15 | 24.3 |
| February 5-11, 2018 | 298.8 | 19 | 15.7 |
| February 12-18, 2018 | 296.3 | 27 | 11.0 |
| Total | 8754.8 | 546 | 16.0 |
* Data source: tokendata.io, icodrops.com, icodata.io, coinschedule.com, cryptocompare.com, smithandcrown.com
Information on funds collected is not available for all ICOs (information for last week is tentative and may be adjusted).
Table 2.2 shows that the largest amount of funds was collected via ICOs in December 2017 and January 2018. The highest average collected funds per ICO equaled $33.17 million, and was seen in June 2017.
The data for last week (February 12-18, 2018) may be adjusted as information on the amounts of funds collected by completed ICOs is finalized.
Figure 2.1. Trends in funds collected and number of ICOs since the start of 2017
2.Top ICOs
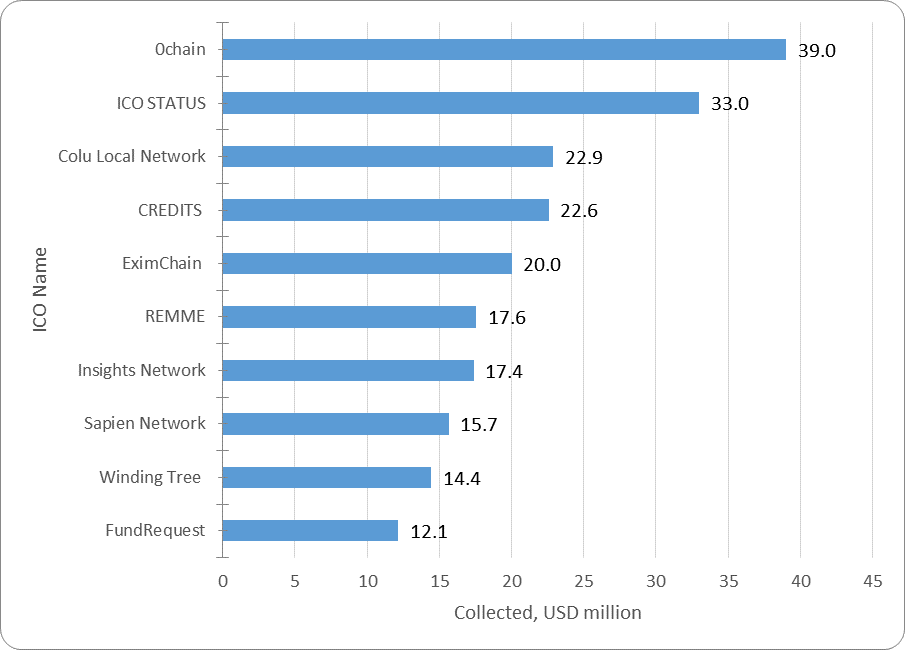
Table 2.3. Top 10 ICOs in terms of the amount of funds collected (February 12-18, 2018)
| № | Name of ICO*** | Category* | Collected, $ million | Date |
| 1 | 0chain | Infrastructure | 39 | February 17, 2018 |
| 2 | ICO STATUS | Infrastructure | 33 | February 16, 2018 |
| 3 | Colu Local Network | Payments | 22.90 | February 18, 2018 |
| 4 | CREDITS | Infrastructure | 22.57 | February 18, 2018 |
| 5 | EximChain | Infrastructure | 20 | February 13, 2018 |
| 6 | REMME | Privacy & Security | 17.56 | February 15, 2018 |
| 7 | Insights Network | Data Analytics | 17.4 | February 14, 2018 |
| 8 | Sapien Network | Content Management | 15.65 | February 15, 2018 |
| 9 | Winding Tree | Travel & Tourism | 14.418 | February 15, 2018 |
| 10 | FundRequest | Trading & Investing | 12.121 | February 14, 2018 |
| Top 10 ICOs | 214.6 | |||
| Total funds collected from February 12-18, 2018 (27 ICOs)** | 296.3 | |||
| Average funds collected | 11 |
* The category was established based on expert opinions.
** When compiling the lists of top ICOs, information from the websites tokendata.io, icodrops.com, icodata.io, coinschedule.com and other specialized sources is used.
*** Only popular and/or successfully completed ICOs (i.e. ICOs which managed to collect the minimum declared amount of funds) and/or ICOs listed on exchanges were considered. Information may be incomplete for some ICOs (for instance, the amount of funds collected).
Table 2.3 shows the top 10 ICOs which were successfully completed during the period February 12-18, 2018. The leader for the week was the 0chain project. 0chian is a zero-cost, superfast, decentralized cloud for DApps for the performance of micro transactions and data storage on any current platform.
Figure 2.2 presents the ten largest ICOs completed last week.
Figure 2.2. Top 10 ICOs in terms of the amount of funds collected (February 12-18, 2018)
3. Top ICOs in their categories
The list of top ICOs by category is compiled with due account of the categories of the leading ICOs for the week.
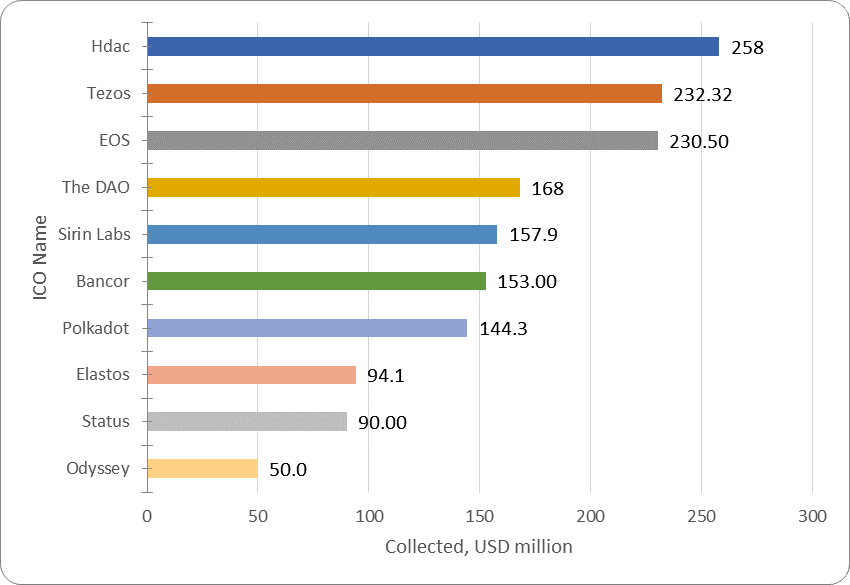
Table 2.4. Top 10 ICOs in terms of the amount of funds collected, Infrastructure category
| № | Name of ICO | Category* | Collected, $ million | Date | Token performance |
| 1 | Hdac | Infrastructure | 258 | December 23, 2017 | n/a |
| 2 | Tezos | Infrastructure | 232.32 | July 13, 2017 | 7.75x |
| 3 | EOS | Infrastructure | 230.50 | July 1, 2017 | 9.78x |
| 4 | The DAO | Infrastructure | 168 | May 28, 2016 | n/a |
| 5 | Sirin Labs | Infrastructure | 157.9 | December 26, 2017 | 1.87x |
| 6 | Bancor | Infrastructure | 153.00 | June 12, 2017 | 1.46x |
| 7 | Polkadot | Infrastructure | 144.3 | October 27, 2017 | n/a |
| 8 | Elastos | Infrastructure | 94.1 | January 23, 2018 | 7.18x |
| 9 | Status | Infrastructure | 90.00 | June 20, 2017 | 6.15x |
| 10 | Odyssey | Infrastructure | 50.0 | January 23, 2018 | 1.65x |
* When compiling the lists of top ICOs, information from the websites tokendata.io, com, icodata.io, coinschedule.com and other specialized sources is used. The ICO project categories correspond to the information from the website coinschedule.com. If there is no information on the website concerning the project category at the time of compilation of this analytical report, the category is determined by experts.
** The top projects in this category completed in January-February 2018 are highlighted in red.
The leader of the week, the 0chain project, did not make the Top 10 in the category.
At present, all projects from the top 10 in the Infrastructure category have a token performance indicator of 1.65x to 9.78x. Two of the top 10 projects completed their ICOs in January 2018. The EOS exchange listing can be considered one of the most successful ICOs, as this project has a current token price to token sale price ratio of 9.78x. When considering this indicator, it is important to remember that the EOS ICO was completed on July 1, 2017, i.e. the 9.78x growth took place over more seven and a half months. The market capitalization of EOS currently exceeds $6.5 billion.
Figure 2.3. Top 10 ICOs in terms of the amount of funds collected, Infrastructure category
In February the ICOs of four projects that can be assigned to the Content Management category were also completed.
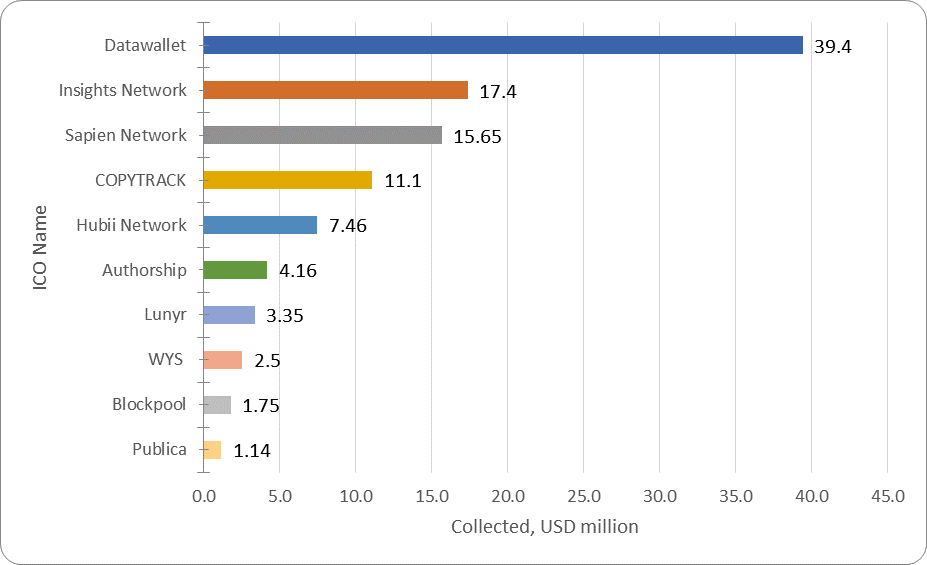
Table 2.5. Top 10 ICOs in terms of the amount of funds collected, Content Management category
| № | Name of ICO | Category* | Collected, $ million | Date | Token performance |
| 1 | Datawallet | Content management | 39.4 | February 6, 2018 | 0.65x |
| 2 | Insights Network | Content management | 17.4 | February 9, 2018 | n/a |
| 3 | Sapien Network | Content Management | 15.65 | February 15, 2018 | n/a |
| 4 | COPYTRACK | Content management | 11.1 | February 10, 2018 | n/a |
| 5 | Hubii Network | Content Management | 7.46 | September 7, 2017 | 3.29x |
| 6 | Authorship | Content Management | 4.16 | September 14, 2017 | n/a |
| 7 | Lunyr | Content Management | 3.35 | April 28, 2017 | 12.06x |
| 8 | WYS | Content management | 2.5 | January 31, 2018 | n/a |
| 9 | Blockpool | Content Management | 1.75 | June 30, 2017 | 2.96x |
| 10 | Publica | Content Management | 1.14 | November 16, 2017 | 6.38x |
* When compiling the lists of top ICOs, information from the websites tokendata.io, com, icodata.io, coinschedule.com and other specialized sources is used. The ICO project categories correspond to the information from the website coinschedule.com. If there is no information on the website concerning the project category at the time of compilation of this analytical report, the category is determined by experts.
** The top projects in this category completed in January-February 2018 are highlighted in red.
At present, the Datawallet project has the largest amount of collected funds in the Content Management category. From among the top 10 projects in the Content Management category, the Lunyr project has the best token performance indicator. Its market capitalization currently exceeds $44 million.
Figure 2.4. Top 10 ICOs in terms of the amount of funds collected, Content Management category
Over the last week (February 12-18, 2018), 27 ICO projects were successfully completed, each of which collected more than $100,000, with a total amount of collected funds of around $300 million. The leader of the past week was the 0chain project ($39 million). The total amount of funds collected by a number of ICOs failed to reach even the $100,000 mark (the information for some projects is still being finalized).
The Glossary is given in Annex 1.
Annex 1 – Glossary
| Key terms | Definition |
| Initial coin offering, ICO | A form of collective support of innovative technological projects, a type of presale and attracting of new backers through initial coin offerings to future holders in the form of blockchain-based cryptocurrencies (tokens) and digital assets. |
| Market capitalization | Value of an asset calculated based on its current market (exchange) price. This economic indicator is used to assess the total aggregate value of market instruments, players, and markets. [Source: https://en.wikipedia.org]. |
| Cryptocurrency market capitalization | Aggregate market value of cryptocurrencies circulating on the market. |
| Total cryptocurrency market capitalization | Cryptocurrency and digital asset market capitalization, i.e. the aggregate market value of all cryptocurrencies and digital assets circulating on the market. |
| Token reward | Token performance (current token price / token sale price during the ICO), i.e. the reward per $1 spent on buying tokens. |
| Dominance | Market share, i.e. the ratio of market capitalization of a particular cryptocurrency (token) to total cryptocurrency market capitalization. Expressed as a %. |
| Token sale price
Current token price |
Token sale price during the ICO.
Current token price. |
| Not Mineable
|
A coin that is not mineable. The term is used for cryptocurrencies (tokens) which cannot be mined or issued through mining. |
| Pre-mined | A pre-mined coin. The term is used for cryptocurrencies (tokens) which are issued through mining, and a certain number of coins (tokens) have been created and distributed among certain users at the start of the project. |
| The rate of market increase (as a % compared to the beginning of the year) | The rate of market increase (as a % compared to the start of the year), i.e. by how many % points did market capitalization increase compared to the start of the year. |
| The growth rate of the market (as a % compared to the beginning of the year) | The market growth (as a % compared to the start of the year), i.e. by how many times did market capitalization grow compared to the start of the year. |
| Increase in market capitalization (in USD million compared to the previous period) | Increase in cryptocurrency and digital asset market capitalization (in USD million compared to the previous period), i.e. by how many USD million did market capitalization increase over the period. |
| The rate of market increase (as a % compared to the previous period) | Rate of market increase (as a % compared to the previous period), i.e. by how many % points did market capitalization increase over the period. |
| The market growth rate (as a % compared to the previous period) | Market growth rate (as a % compared to the previous period), i.e. by how many times did market capitalization grow compared to the previous period. |
| Number of cryptocurrencies and digital assets | Number of cryptocurrencies and digital assets. At the time when this glossary was compiled over 1,070 cryptocurrencies and digital assets were circulating on the market. |
| Average market capitalization | Average market capitalization, i.e. the ratio of the market capitalization of all cryptocurrencies and digital assets to their number. |
| Token return | Performance of funds spent on buying tokens or the ratio of the current token price to the token sale price, i.e. performance of $1 spent on buying tokens during the token sale, if listed on an exchange for USD. |
| ETH reward – current dollar value of $1 spent on buying tokens during the token sale | Alternative performance indicator of funds spent on buying tokens during the ICO or the ratio of the current ETH rate to its rate at the start of the token sale, i.e. if instead of buying tokens $1 was spent on buying ETH at its rate at the start of the token sale and then it was sold at the current ETH rate. |
| BTC reward– current dollar value of $1 spent on buying tokens during the token sale | Similar to the above: Alternative performance indicator of funds spent on buying tokens during the token sale, i.e. if instead of buying tokens $1 was spent on buying BTC at its rate at the start of the token sale and then it was sold at the current BTC rate. |
| Token/ETH reward | This ratio describes the backer’s economic benefits and disadvantages resulting from buying tokens during the token sale relative to buying ETH. If the result is over 1, the backer spent his funds more efficiently on buying tokens than if he were to have spent his funds on ETH. |
| Token/BTC reward | This ratio describes the backer’s economic benefits and disadvantages resulting from buying tokens during the token sale relative to buying BTC. If the result is over 1, the backer spent his funds more efficiently on buying tokens than if he were to have spent his funds on BTC. |
| ZAK-n Crypto index | The index is calculated as a percentage and represents a ratio between the 24-hour trading volume (transactions) on cryptocurrency exchanges per day (Volume 24h) for n dominant cryptocurrencies to their total market capitalization.
ZAK-4 Crypto index calculations include four dominant cryptocurrencies with the greatest market capitalization: Bitcoin, Ethereum, Bitcoin Cash, and Ripple. ZAK-8 Crypto index calculations include the trading volume and market capitalization for eight cryptocurrencies. |
The post Cryptocurrency and ICO Market Analysis [February 12-18, 2018] appeared first on CoinSpeaker.