Price Analysis November 6: BTC, ETH, LTC, EOS, BCH
Coinspeaker
Price Analysis November 6: BTC, ETH, LTC, EOS, BCH
Dmitriy Gurkovskiy, a senior analyst at foreign exchange broker RoboForex, shares his insights into the future scenarios for Bitcoin price movement as well as possible price swings of major altcoins.
The Bitcoin keeps correcting inside a flat. There are expressed resistance and support areas on the chart but the quotations have not yet managed to escape the channel. There are chances that, however, the leading cryptocurrency might break through the upper border of the range and start good growth. The EOS and Bitcoin Cash are also promising growth; what is more, on H4 of the Bitcoin Cash there is potential for a reversal pattern of growth to form near $250. The Ethereum and Litecoin, in their turn, are not likely to grow from the current levels. Nonetheless, if the buyers manage to break away the resistance level soon, we should expect development there.
Bitcoin
The cryptocurrency is featuring low volatility; since the publication of the last tech analysis, not much has changed. There is still pressure from the buyers, and the quotations remain above the descending trendline. Currently, the main idea is still a test of the broken trendline at $8,635 and a movement to $12,405. An additional signal confirming this scenario might be a test of the ascending support line on the RSI. The scenario may no longer be valid in the case of a steep decline below $7,660; if so, we should expect further falling to $6,875.
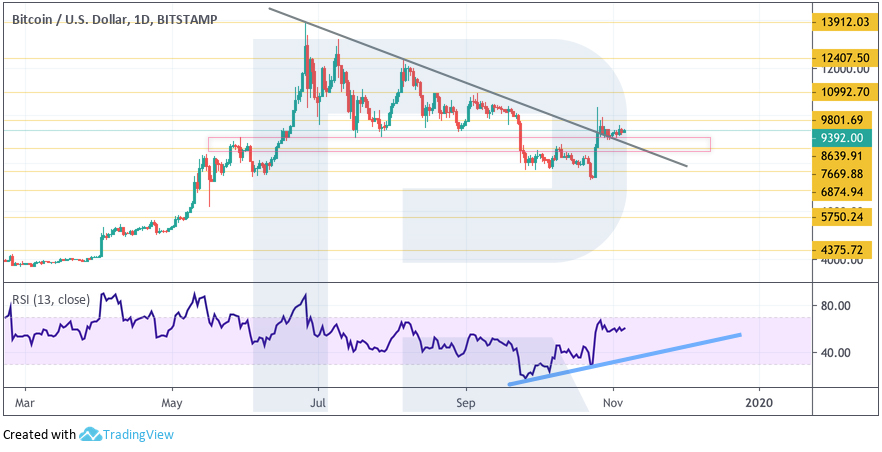
Photo: Roboforex / TradingView
On H4, the quotations are squeezed between the resistance level at $9,800 and the support level at $8,635. The RSI values are near the middle levels which does not look like a good signal now. However, in case the correction develops and the quotations test the support level, a test of the ascending trendline on the RSI should happen, which will signal a bounce and the beginning of growth. The latter should be confirmed by a breakaway of the resistance level and securing above $9,800; if so, the nearest aim of the growth will be around $10,990. A breakaway of this level will signal an escape from the descending channel and switching to full-scale growth with the potential aim at $13,915. The scenario may be canceled in the case of a breakaway of $8,635, which will signal falling to $7,670 and below.
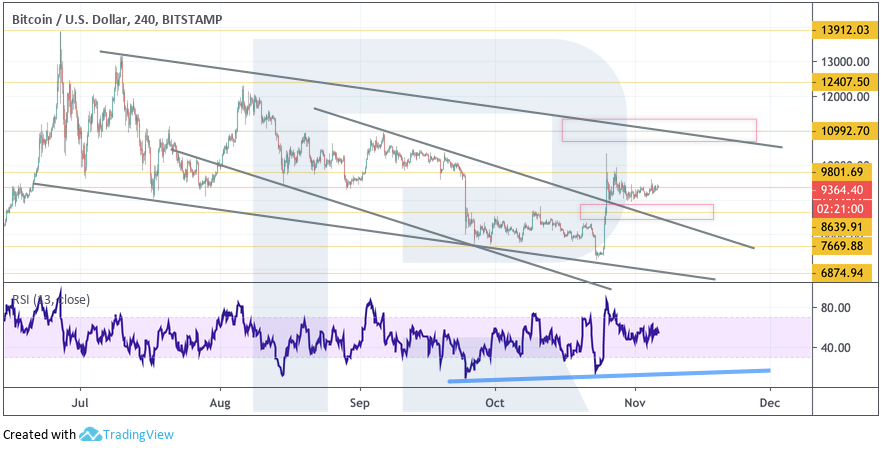
Photo: Roboforex / TradingView
Ethereum
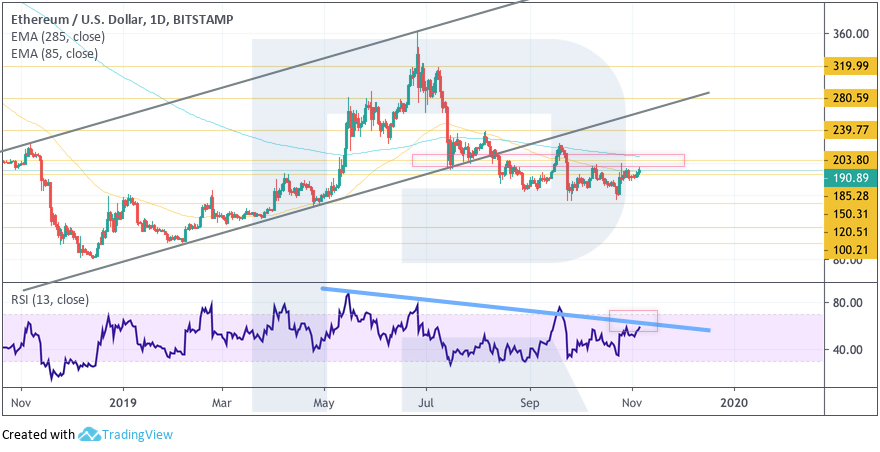
There is still pressure from the sellers. The quotations are testing the area between the Moving Averages, which signals a potential bounce downwards from the current levels. The probable decline is also confirmed by the test of the descending trendline on the RSI. The first aim of the decline might be at $185. A breakaway of this level may signal further falling to $150. The negative scenario might be canceled by strong growth above $240, in which case the downtrend will turn into account an uptrend.
On smaller timeframes, the quotations are declining inside a descending channel. However, the upper border of the channel has not been tested yet, so we should expect ETH/USD to grow to $230 and then fall to $150. Yet another signal of the decline is a test of the resistance line on the RSI; earlier, the prices pushed off it. The sellers will keep pressing on the price until the quotations escape the descending channel. Only after a breakaway of the resistance level and closing above $205 we may expect further growth.
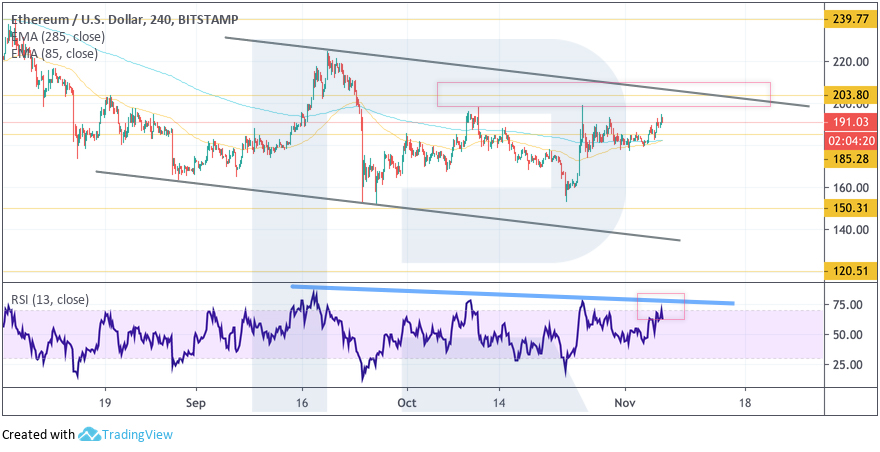
Photo: Roboforex / TradingView
Litecoin
On D1, the quotations are testing the MAs, which means the continuation of the downtrend; as we may see, the prices have failed to rise above the MAs. From the current levels, we should expect further decline with the first aim at $42. A strong signal confirming the decline will be a test of the resistance line on the RSI. However, if the LTC/USD quotations break this line away, they will most probably reverse and start growing with the aims at $125 and then $146. The scenario of the decline might be canceled by a breakaway of the resistance line and securing above $79.
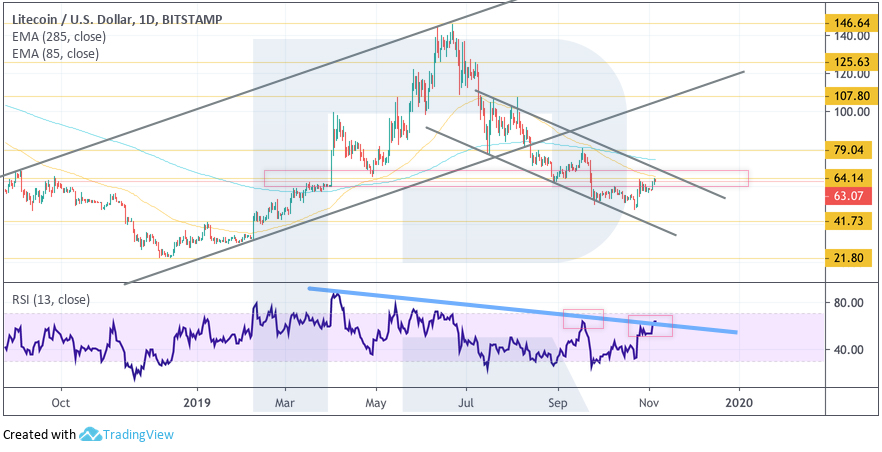
Photo: Roboforex / TradingView
On H4, the quotations are testing the upper border of of the descending channel. This area will make a good resistance level, we should expect further falling. A strong signal confirming the latter will be a test of the resistance line on the RSI. However, the prices have broken through the MAs, which means pressure from the buyers. A breakaway of the upper border of the descending channel will signal a movement to $79.
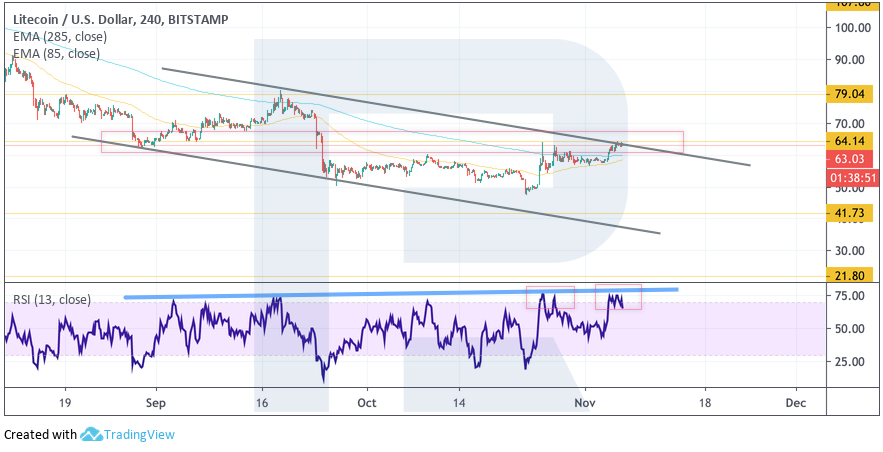
Photo: Roboforex / TradingView
EOS
The quotations are trading above the Ichimoku Cloud, which signifies the beginning of an uptrend and pressure from the buyers. As a rule, after the Cloud is broken away there follows a test of the broken Cloud border and further growth. However, here we also see the upper border of the descending channel, and a breakaway of $4.30 will signal an escape from the channel and a full-scale development of the uptrend. This scenario is also confirmed by a breakaway of the descending resistance line on the RSI. A breakaway of this line means probable growth to $5.35. The scenario of the growth may be canceled by falling of the asset and securing under $2.97, which will mean the downtrend resumes.
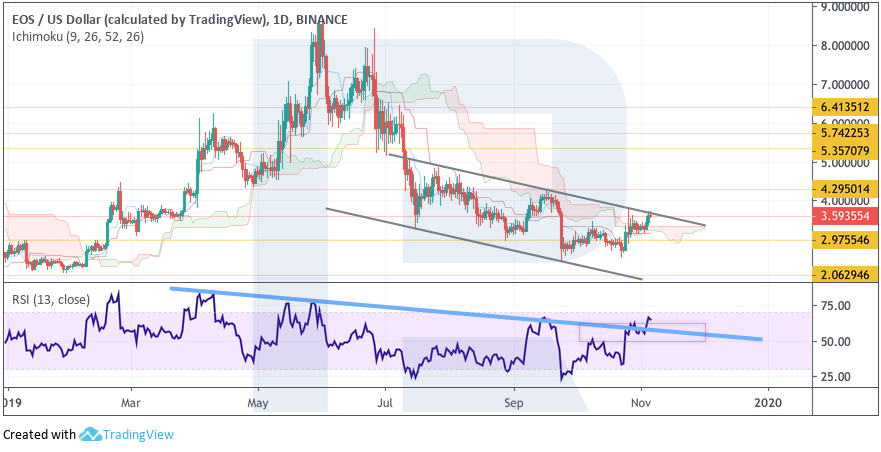
Photo: Roboforex / TradingView
On smaller timeframes, the quotations are also above the Cloud. Here, they have already broken through the upper border of the descending channel. We should expect a moderate descending correction and further growth with the first aim at $4.30. A good signal confirming the growth will be a test of the ascending trendline on the RSI as well as a bounce off the upper border of the descending channel. The positive scenario for the EOS buyers may be canceled in the case of a breakaway of the lower border of the Cloud and securing under $2.97.

Photo: Roboforex / TradingView
Bitcoin Cash
Earlier, on D1 we watched a reversal Head and Shoulders pattern forming, however, the market decided against executing it. Many tech analysts state that if the market moves counter the pattern there is a chance for a movement in the opposite direction. So, in our case, after securing of the quotations above $335 we should expect strong growth of the cryptocurrency. This scenario is confirmed by a breakaway of the descending trendline on the RSI, which by itself is a strong signal of growth. The scenario might be canceled by falling below $165.
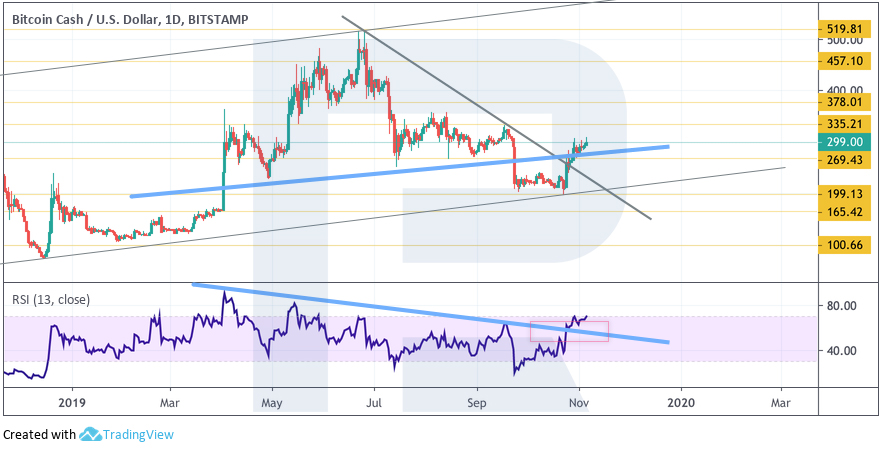
Photo: Roboforex / TradingView
On H4, the reversal Head and Shoulders pattern might form yet. To see this pattern complete, we should see the BCH/USD quotations fall to $250, from where an upward movement might start. A strong signal confirming the bounce might be a test of the support line on the RSI. The growth should be confirmed by a breakaway of $335. The pattern might be canceled by falling below $199, in which case the quotations will keep declining.
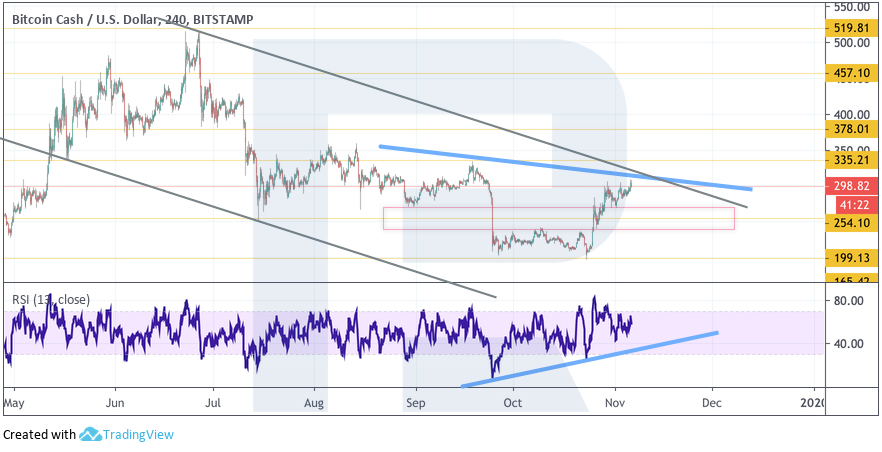
Photo: Roboforex / TradingView