ICO Market Analysis [March 12-18, 2018]
Information as of March 19, 2018
This report was created by:
- Professor Dmitrii Kornilov, Doctor of Economics, Member of the Russian Academy of Natural Sciences, and Leading Analyst at ICOBox;
- Dima Zaitsev, PhD in Economics, Head of International Public Relations and Business Analytics Department Chief at ICOBox;
- Nick Evdokimov, Co-Founder of ICOBox;
- Mike Raitsyn, Co-Founder of ICOBox;
- Anar Babaev, Co-Founder of ICOBox;
- Daria Generalova, Co-Founder of ICOBox;
This report presents data on the ICO market changes during 2017-2018. Special emphasis has been placed on an analysis of the changes that have taken place in March 2018, including over the last week (March 12-18, 2018).
1. General analysis of the ICO market (by week, month)
1.1. Brief overview of ICO market trends
Table 1.1. Brief ICO market overview, key events, news for the week of March 12-18, 2018
| № | Factors and events
(link to source) |
Date of news | Description | Type of impact |
| 1. | South Korea is Planning to Allow ICOs with New Regulations, Says New Report [source: Coinspeaker] | March 13, 2018 | The competent authorities of South Korea are considering the possibility of removing the ban on participation by its citizens in ICOs. | ICO ⇑
Favorable |
| 2. | Chat App Giant Telegram Bans Sanctioned Individuals, Territories From ICO – Report [source: Cointelegraph] | March 15, 2018 | The Telegram ICO will not be open to persons on international sanctions lists, or those from sanctioned territories. | Uncertain |
| 3. | Luxembourg Financial Regulator Warns of Cryptocurrencies [source: Cointelegraph] | March 17, 2018 | The financial regulator of Luxembourg has issued a report that talks about the risks of participation in ICOs and the purchase of cryptocurrencies. However, blockchain technology was given a positive assessment by the regulator. | ICO ⇓
Unfavorable |
| 4. | Bercy Wants to Make Paris the Capital of the ICO [source: Lesechos] | March 17, 2018 | The French financial regulator is preparing a new law on the holding of ICOs. As mentioned in the announcement, the new law should give industry participants legal certainty and facilitate the development of the new industry. | ICO ⇑
Favorable |
Table 1.2 shows the development trends on the ICO market since 2017. Only popular and/or successfully completed ICOs (i.e. ICOs which managed to collect the minimum declared amount of funds) and/or ICOs listed on exchanges were considered.
Table 1.2. Aggregated trends and performance indicators of past (completed) ICOs1
| Indicator | Total
20172 |
January
20183 |
February
2018 |
March 1-4,
2018 |
March 5-11,
2018 |
March 12-18,
2018 |
| Total amount of funds collected, USD million | 6 890 | 1 733.6 | 2 832.1 | 158.3 | 224.3 | 5542.7 |
| Number of companies that completed an ICO1 | 514 | 102 | 107 | 8 | 15 | 17 |
| Maximum collected, USD million (ICO name) | 258
(Hdac) |
100
(Envion) |
850
(Pre-ICO-1 TON) |
50
(LeadCoin) |
48.8 (Savedroid) | 5000
(Petro Pre-Sale) |
| Average collected funds, USD million | 13.4 | 17 | 26.5 | 19.8 | 15.0 | 326 |
Note:
1 Data source: tokendata.io, icodrops.com, icodata.io, coinschedule.com, cryptocompare.com, smithandcrown.com. For some ICOs information may currently be incomplete (for instance, the amount of funds collected). ICOs that collected less than $100,000 were not considered.
2 More than 1,000 ICOs were performed in 2017. However, the data for the 514 largest and most popular ICOs, the data of which can be processed, were considered when calculating the total amount of funds collected during 2017.
2 The data for 2018 have been updated (date updated: March 18, 2018).
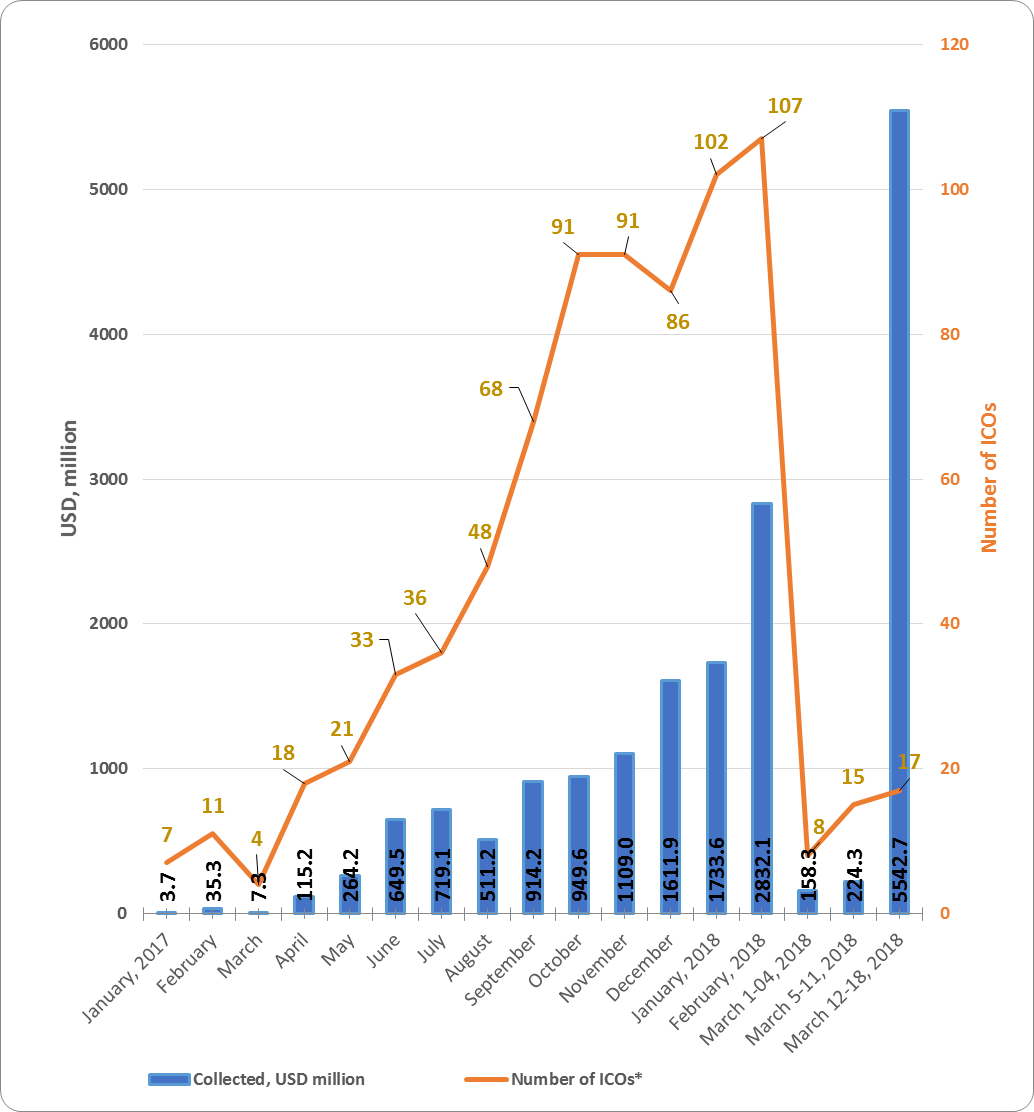
The data for the previous week (March 5-11, 2018) were adjusted to account for the appearance of more complete information on past ICOs. The amount of funds collected via ICOs during the past week (March 12-18, 2018) equaled $5,542.7 million.
This amount consists of the results of 17 successfully completed ICOs, with the largest amount of funds collected equaling $5,000 million (Petro Pre-Sale). The average collected funds per ICO project equaled 326 million (see Tables 1.2, 1.3).
Table 1.3. Amount of funds collected and number of ICOs
| Month | Collected,
$ million |
Number of ICOs* | Average collected,
$ million |
| January 2017 | 3.7 | 7 | 0.53 |
| February | 35.3 | 11 | 3.21 |
| March | 7.3 | 4 | 1.82 |
| April | 115.2 | 18 | 6.4 |
| May | 264.2 | 21 | 12.58 |
| June | 649.5 | 33 | 19.68 |
| July | 719.1 | 36 | 19.97 |
| August | 511.2 | 48 | 10.65 |
| September | 914.2 | 68 | 13.44 |
| October | 949.6 | 91 | 10.44 |
| November | 1 109 | 91 | 12.19 |
| December | 1 611.9 | 86 | 18.74 |
| Total, 2017 | 6 890.1 | 514 | 13.4 |
| January 2018 | 1 733.6 | 102 | 17 |
| February 2018*** | 2 832.1 | 107 | 26.5 |
| March 1-4, 2018 | 158.3 | 8 | 19.8 |
| March 5-11, 2018 | 224.3 | 15 | 15 |
| March 12-18, 2018*** | 5542.7 | 17 | 326 |
| Total | 17381.1 | 763 | 22.8 |
* Data source: tokendata.io, icodrops.com, icodata.io, coinschedule.com, cryptocompare.com, smithandcrown.com.
Information on funds collected is not available for all ICOs (information for last week is tentative and may be adjusted). ICOs that collected less than $100,000 were not considered.
** More than 1,000 ICOs were performed in 2017. However, the data for the 514 largest and most popular ICOs, the data of which can be processed, were considered when calculating the total amount of funds collected during 2017 (data updated: March 18, 2018).
*** Taking into account the pre-ICO-1 of TON, and the Petro Pre-Sale.
Table 1.3 shows that the largest amount of funds was collected via ICOs in February 2018, but March 2018 has already nearly doubled February’s result. The highest average collected funds per ICO was also seen in March 2018.
Figure 1.1. Trends in funds collected and number of ICOs since the start of 2017
1.2. Top ICOs of last week
Table 1.4 shows the ten largest ICOs of the week*
Table 1.4. Top 10 ICOs in terms of the amount of funds collected (March 12-18, 2018)
| № | Name of ICO*** | Category** | Collected, $ million | Date |
| 1 | Petro Pre-Sale | Commodities | 5000 | March 19, 2018 |
| 2 | Dragon Coin | Gambling & Betting | 320 | March 15, 2018 |
| 3 | Endor | Machine Learning & AI | 45 | March 14, 2018 |
| 4 | YGGDRASH | Infrastructure | 40 | March 13, 2018 |
| 5 | Play2Live | Commerce & Advertising | 30 | March 14, 2018 |
| 6 | KYC Legal | Identity & Reputation | 22.5 | March 13, 2018 |
| 7 | Crafty | Machine Learning & AI | 21 | March 14, 2018 |
| 8 | SyncFab | Supply & Logistics | 13 | March 15, 2018 |
| 9 | VALID | Content Management | 10.7 | March 17, 2018 |
| 10 | Denaro | Infrastructure | 10.4 | March 15, 2018 |
| Top 10 ICOs* | 5512.7 | |||
| Total funds collected from March 12-18, 2018 (17 ICOs)* | 5542.7 | |||
| Average funds collected | 326 |
* When compiling the lists of top ICOs, information from the websites tokendata.io, icodrops.com, icodata.io, coinschedule.com and other specialized sources is used.
** The category was established based on expert opinions.
*** Only popular and/or successfully completed ICOs (i.e. ICOs which managed to collect the minimum declared amount of funds) and/or ICOs listed on exchanges were considered. Information may be incomplete for some ICOs (for instance, the amount of funds collected). ICOs that collected less than $100,000 were not considered.
The data for last week (March 12-18, 2018) may be adjusted as information on the amounts of collected funds by completed ICOs is finalized.
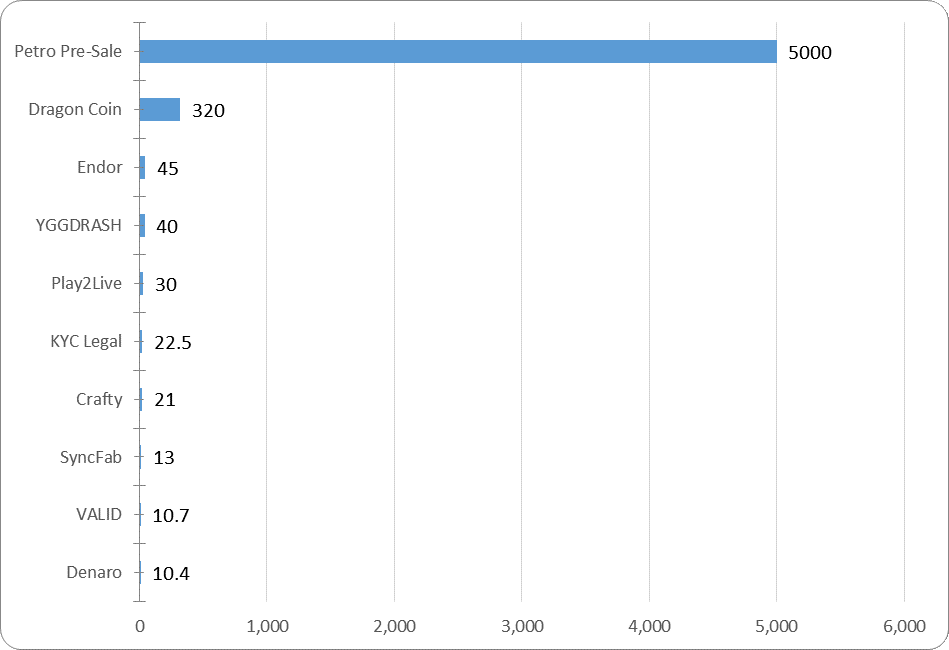
The leaders for the week were the Petro Pre-Sale and Dragon Coin projects.
The Petro project is the first sovereign token issue, which, on the one hand, can be called a loan to the Venezuelan government, and which falls under US sanctions.
On the other hand, this is a grandiose project, under which a country issued a crypto asset supported by oil reserves. This will serve as the financial platform for developing the country’s industrial sector, making it possible to perform purchase and sale transactions with crude using digital assets. This is a step toward a new, open, and transparent digital economy.
Dragon Coin is a casino built on blockchain technology and cryptocurrencies, which will make it possible to expand the audience and the geographical boundaries of the players.
Figure 1.2 presents the ten largest ICOs completed last week.
Figure 1.2. Top 10 ICOs in terms of the amount of funds collected (March 12-18, 2018)
1.3. Top ICOs in their categories
The list of top ICOs by category is compiled with due account of the categories of the leading ICOs for the week.
Table 1.5. Top 10 ICOs in terms of the amount of funds collected, Gambling & Betting category
| № | Name of ICO | Category* | Collected, $ million | Date | Token performance |
| 1 | Dragon Coin | Gambling & Betting | 320 | March 15, 2018 | n/a |
| 2 | Unikoingold | Gambling & Betting | 32.3 | October 23, 2017 | 0.60x |
| 3 | FunFair | Gambling & Betting | 26.0 | June 23, 2017 | 4.93x |
| 4 | DECENT Bet | Gambling & Betting | 16.2 | October 23, 2017 | n/a |
| 5 | DAO.casino | Gambling & Betting | 12.4 | July 21, 2017 | 0.52x |
| 6 | Wagerr | Gambling & Betting | 11.8 | June 22, 2017 | 3.82x |
| 7 | BitDice | Gambling & Betting | 8.7 | September 15, 2017 | 1.18x |
| 8 | True Flip Lottery | Gambling & Betting | 8.2 | July 28, 2017 | 0.91x |
| 9 | Sp8de | Gambling & Betting | 7.2 | March 11, 2018 | n/a |
| 10 | BetKing | Gambling & Betting | 6.5 | September 4, 2017 | n/a |
* When compiling the lists of top ICOs, information from the websites tokendata.io, com, icodata.io, coinschedule.com and other specialized sources is used. The ICO project categories correspond to the information from the website coinschedule.com. If there is no information on the website concerning the project category at the time of compilation of this analytical report, the category is determined by experts.
** The top projects in this category completed in March 2018 are highlighted in red.
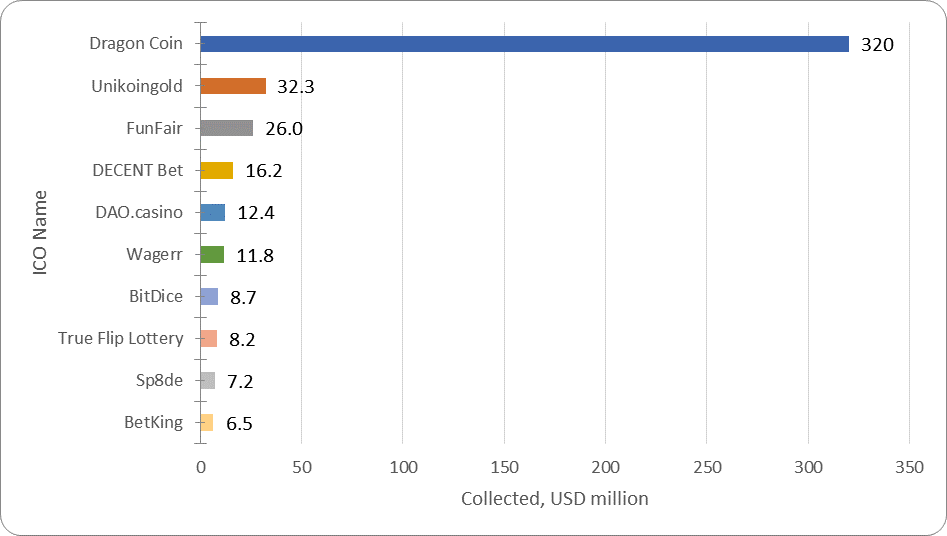
The Dragon Coin and Sp8de projects were completed in March 2018 and are included in the top 10 ICOs in the Gambling & Betting category. The funds collected by Dragon Coin differ from the funds collected by the other ICOs in this category by a factor of 10.
At present, all projects from the top 10 in this category have a token performance indicator of 0.52x to 4.93x. The FunFair project can be considered one of the most successful exchange listings, as this project has a current token price to token sale price ratio of 4.93x.
When considering this indicator, it is important to remember that the FunFair ICO was completed on June 23, 2017, i.e. the 5x growth took place over approximately eight months. The market capitalization of FunFair currently exceeds $170 million.
Figure 1.3. Top 10 ICOs in terms of the amount of funds collected, Gambling & Betting category
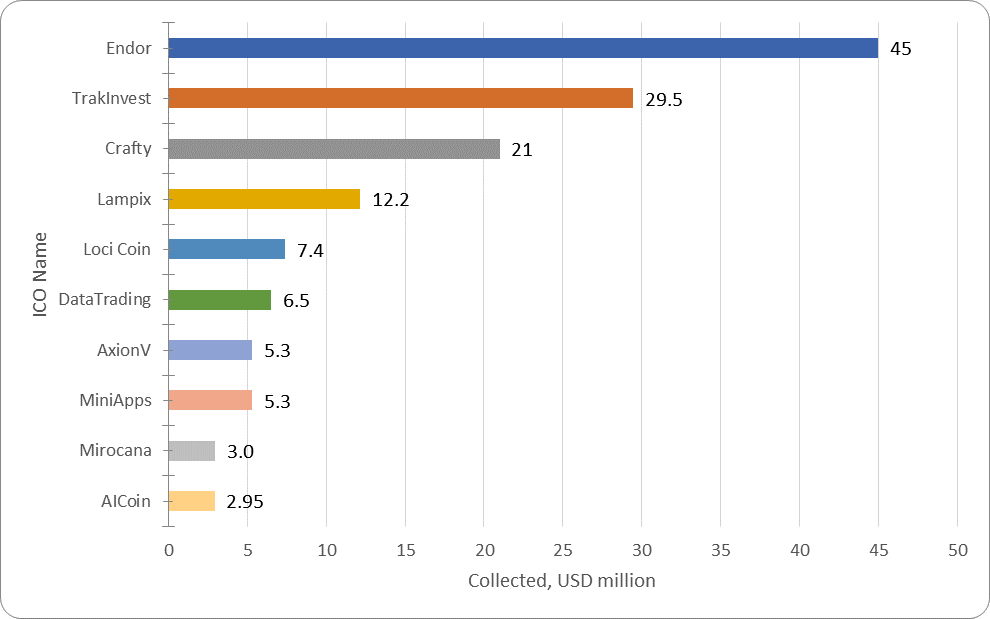
The ICOs of three projects that can be assigned to the Machine Learning & AI category and became the leaders in the top 10 of this category were also completed in March.
Table 1.6. Top 10 ICOs in terms of the amount of funds collected, Machine Learning & AI category
| № | Name of ICO | Category* | Collected, $ million | Date | Token performance |
| 1 | Endor | Machine Learning & AI | 45 | March 14, 2018 | n/a |
| 2 | TrakInvest | Machine Learning & AI | 29,5 | March 7, 2018 | n/a |
| 3 | Crafty | Machine Learning & AI | 21 | March 14, 2018 | n/a |
| 4 | Lampix | Machine Learning & AI | 12.2 | August 19, 2017 | 0.12x |
| 5 | Loci Coin | Machine Learning & AI | 7.4 | December 31, 2017 | n/a |
| 6 | DataTrading | Machine Learning & AI | 6.5 | February 28, 2018 | n/a |
| 7 | AxionV | Machine Learning & AI | 5.3 | September 30, 2017 | n/a |
| 8 | MiniApps | Machine Learning & AI | 5.3 | December 19, 2017 | n/a |
| 9 | Mirocana | Machine Learning & AI | 3.0 | December 19, 2017 | n/a |
| 10 | AICoin | Machine Learning & AI | 2.95 | August 28, 2017 | n/a |
* When compiling the lists of top ICOs, information from the websites tokendata.io, com, icodata.io, coinschedule.com and other specialized sources is used. The ICO project categories correspond to the information from the website coinschedule.com. If there is no information on the website concerning the project category at the time of compilation of this analytical report, the category is determined by experts.
** The top projects in this category completed in March 2018 are highlighted in red.
There is not enough information to draw any conclusions on the token performance of the projects in this category. Three of the ICOs were completed in March 2018.
Figure 1.4. Top 10 ICOs in terms of the amount of funds collected,Machine Learning & AI category
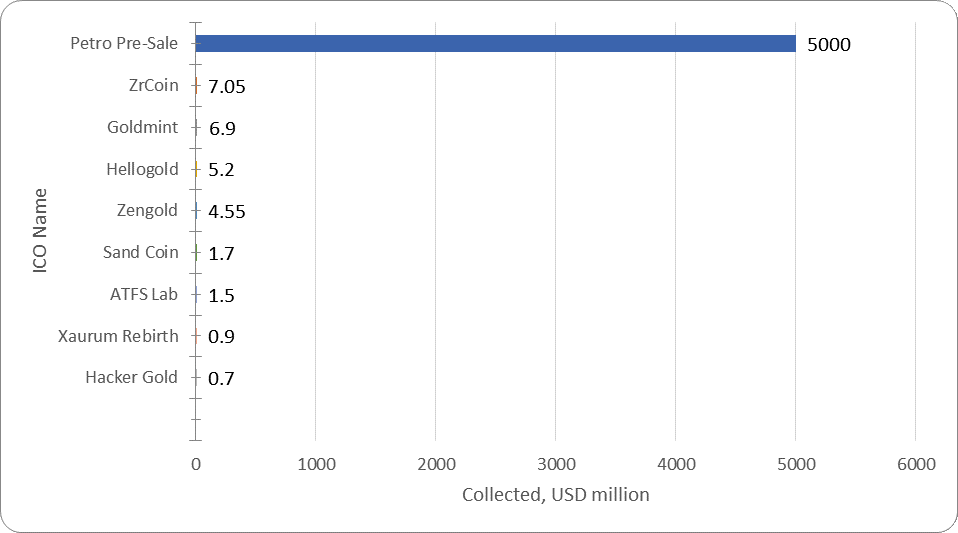
Following the precedent set by the Petro ICO, the scale of funds collected in the Commodities category may soon increase significantly.
Table 1.7. Top 9 ICOs in terms of the amount of funds collected, Commodities category
| № | Name of ICO | Category* | Collected, $ million | Date | Token performance |
| 1 | Petro Pre-Sale | Commodities | 5000 | March 19, 2018 | n/a |
| 2 | ZrCoin | Commodities | 7.05 | June 9, 2017 | 0.88x |
| 3 | Goldmint | Commodities | 6.9 | November 11, 2017 | 0.34x |
| 4 | Hellogold | Commodities | 5.2 | October 5, 2017 | n/a |
| 5 | Zengold | Commodities | 4.55 | May 26, 2017 | n/a |
| 6 | Sand Coin | Commodities | 1.7 | October 18, 2017 | 0.88x |
| 7 | ATFS Lab | Commodities | 1.5 | February 10, 2018 | n/a |
| 8 | Xaurum Rebirth | Commodities | 0.9 | July 31, 2016 | n/a |
| 9 | Hacker Gold | Commodities | 0.7 | December 21, 2016 | n/a |
* When compiling the lists of top ICOs, information from the websites tokendata.io, com, icodata.io, coinschedule.com and other specialized sources is used. The ICO project categories correspond to the information from the website coinschedule.com. If there is no information on the website concerning the project category at the time of compilation of this analytical report, the category is determined by experts.
** The top projects in this category completed in March 2018 are highlighted in red.
The Commodities category includes secured projects. For example, the Petro project is secured with oil, ZrCoin with an option for industrial synthetic zirconium dioxide products, while Goldmint positions itself as a cryptocurrency secured by gold, etc.
Three of the projects included in the top 9 have a token performance indicator of less than one.
Figure 1.5. Top 9 ICOs in terms of the amount of funds collected, Commodities category
Last week (March 12-18, 2018) at least 17 ICO projects were successfully completed, each of which collected more than $100,000, with the total amount of funds collected exceeding $5.5 billion. Last week’s leader was the Petro project (Pre-Sale $5 billion). The total amount of funds collected by a number of ICOs failed to reach even the $100,000 mark (the information for some projects is still being finalized).
Annex – Glossary
| Key terms | Definition |
| Initial coin offering, ICO | A form of collective support of innovative technological projects, a type of presale and attracting of new backers through initial coin offerings (token sales) to future holders in the form of blockchain-based cryptocurrencies and digital assets. |
| Token sale price
Current token price |
Token sale price during the ICO.
Current token price. |
| Token reward | Token performance (current token price ÷ token sale price during the ICO), i.e. the reward per $1 spent on buying tokens. |
| Token return | (see token reward) Performance of funds spent on buying tokens or the ratio of the current token price to the token sale price, i.e. performance of $1 spent on buying tokens during the token sale, if listed on an exchange for USD. |
| ETH reward – current dollar value of $1 spent on buying tokens during the token sale | Alternative performance indicator of funds spent on buying tokens during the ICO or the ratio of the current ETH price to its price at the start of the token sale, i.e. if instead of buying tokens $1 was spent on buying ETH at its rate at the start of the token sale and then it was sold at the current ETH price. |
| BTC reward– current dollar value of $1 spent on buying tokens during the token sale | Similar to the above: Alternative performance indicator of funds spent on buying tokens during the token sale, i.e. if instead of buying tokens $1 was spent on buying BTC at its price at the start of the token sale and then it was sold at the current BTC price. |
| Token/ETH reward | This ratio describes a market participant’s economic benefits and disadvantages resulting from buying tokens during the token sale relative to buying ETH. If the result is over 1, the market participant spent his funds more efficiently on buying tokens than if he were to have spent his funds on ETH. |
| Token/BTC reward | This ratio describes the market participant’s economic benefits and disadvantages resulting from buying tokens during the token sale relative to buying BTC. If the result is over 1, the market participant spent his funds more efficiently on buying tokens than if he were to have spent his funds on BTC. |
The post ICO Market Analysis [March 12-18, 2018] appeared first on CoinSpeaker.