Crypto Price Analysis May 20: BTC, ETH, LTC, BCH, EOS
Coinspeaker
Crypto Price Analysis May 20: BTC, ETH, LTC, BCH, EOS
Dmitriy Gurkovskiy, a senior analyst at foreign exchange broker RoboForex, provides his vision of the possible tendencies in price changes for Bitcoin as well as for other major cryptos.
Cryptocurrencies continue rising slowly; as we can see, the bullish pressure isn’t going down. Bitcoin has got very close to a very important level at $10,000, a breakout of which may result in an aggressive growth towards $13,865. However, conservatively, it would be better to see a strong rebound to the downside before further growth. It will largely depend on a breakout of a “Triangle” pattern on shorter timeframes. Whereas Bitcoin and Ethereum are looking pretty confident, daily charts of Litecoin and Bitcoin Cash don’t show that these assets are ready to rise in the nearest future – there are patterns here that indicate a possible short-term decline. However, if bulls are able to push Bitcoin towards new highs, altcoins may also take up this initiative and start growing.
Bitcoin
In the daily chart, bears continue to defend a very important resistance level at $10,000. Here, there is still a potential for a new decline towards $5,760, where the asset may finish an inverted “Head & Shoulders” and, as a result, offer a good area for conservative purchases. A strong signal in favor of this idea is a rebound from the resistance line at the RSI. Another this to confirm this scenario is a breakout of $8,360, after which the pair may leave the ascending channel. However, this bearish scenario may no longer be valid if the price skyrockets, breaks the resistance level, and fixes above $10,565. In this case, the instrument may resume the uptrend with the first upside target at $13,865.
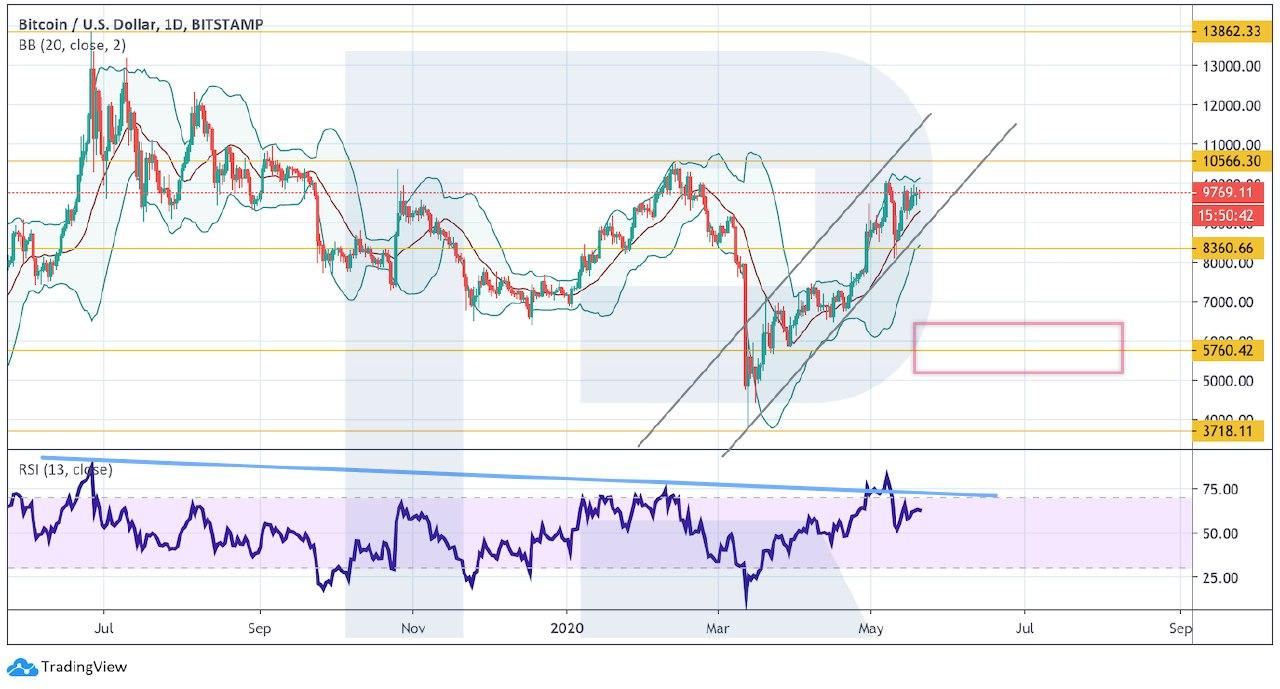
Photo: Roboforex / TradingView
As we can see in the H4 chart, Bitcoin is stuck inside the “Triangle” pattern. To start a new decline, the pair must break the pattern’s downside border and fix below $9,050. After that, the instrument may continue falling with the target at $8,180. A signal in favor of this idea will be a rebound from the trendline at the RSI. However, this scenario may be canceled if the price breaks the pattern’s upside border and fixes above $10,075. In this case, the asset may continue growing to break $10,565.
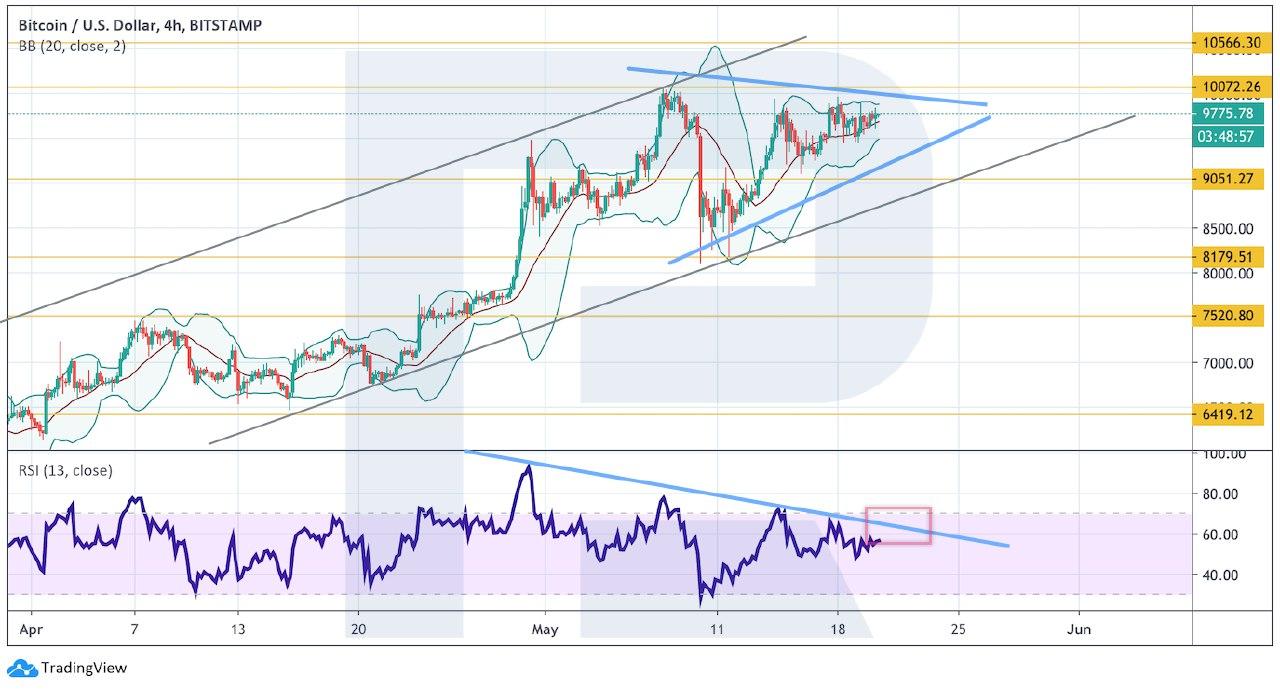
Photo: Roboforex / TradingView
Ethereum
As we can see in the daily chart, Ethereum has rebounded from the downside border of Bollinger Bands once again, thus indicating a bullish impulse. However, there is a potential for the formation of a “Double Top” reversal pattern. To complete the pattern, the pair must break the support level and fix below $176. In this case, the price may continue falling with the target at $148. Another signal in favor of this idea may be a rebound from the trendline at the RSI. However, this scenario may no longer be valid if the instrument breaks the resistance line and fixes above $235. In this case, the pattern will be canceled and the asset may continue trading upwards with the target at $287.
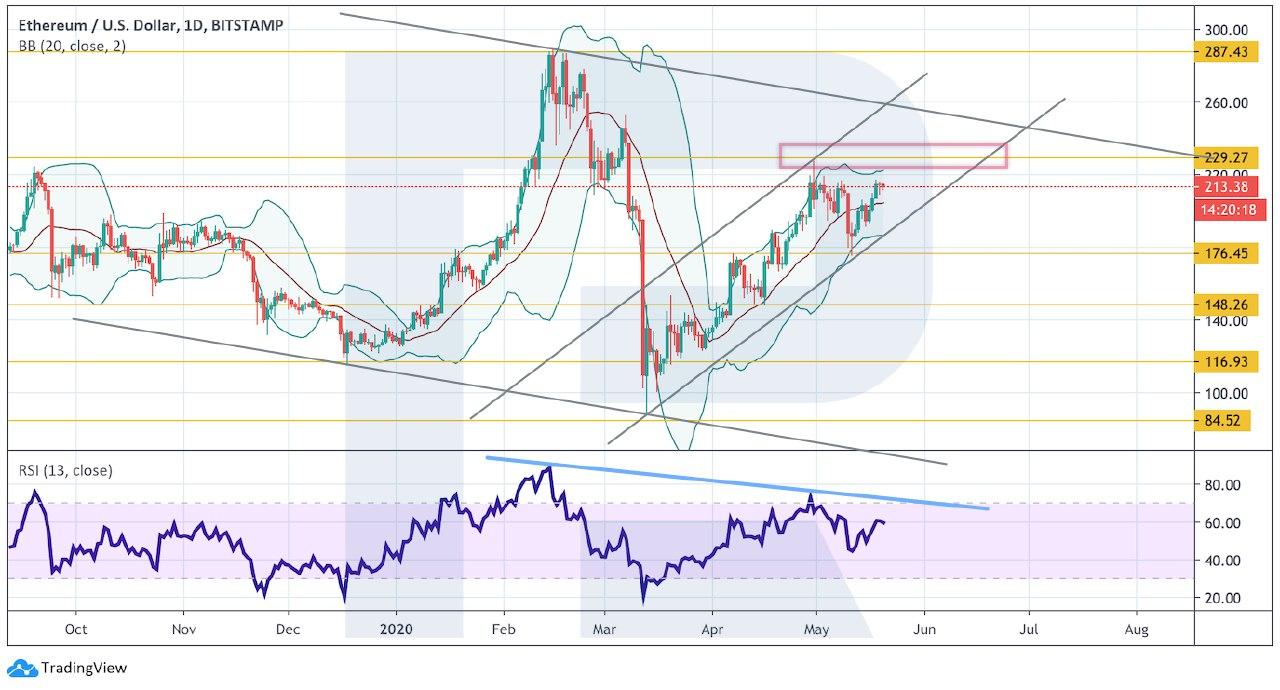
Photo: Roboforex / TradingView
On shorter timeframes, ETH/USD broke the channel’s downside border but couldn’t continue falling. The RSI indicator is also testing the support line, thus hinting at a possible continuation of growth with the target at $229. However, if later bears are able to prevent the price from breaking the highs, the pair may rebound and resume falling inside the “Double Top” reversal pattern. This scenario may be canceled if the instrument breaks the resistance line. In this case, the asset may continue moving upwards to reach $250.
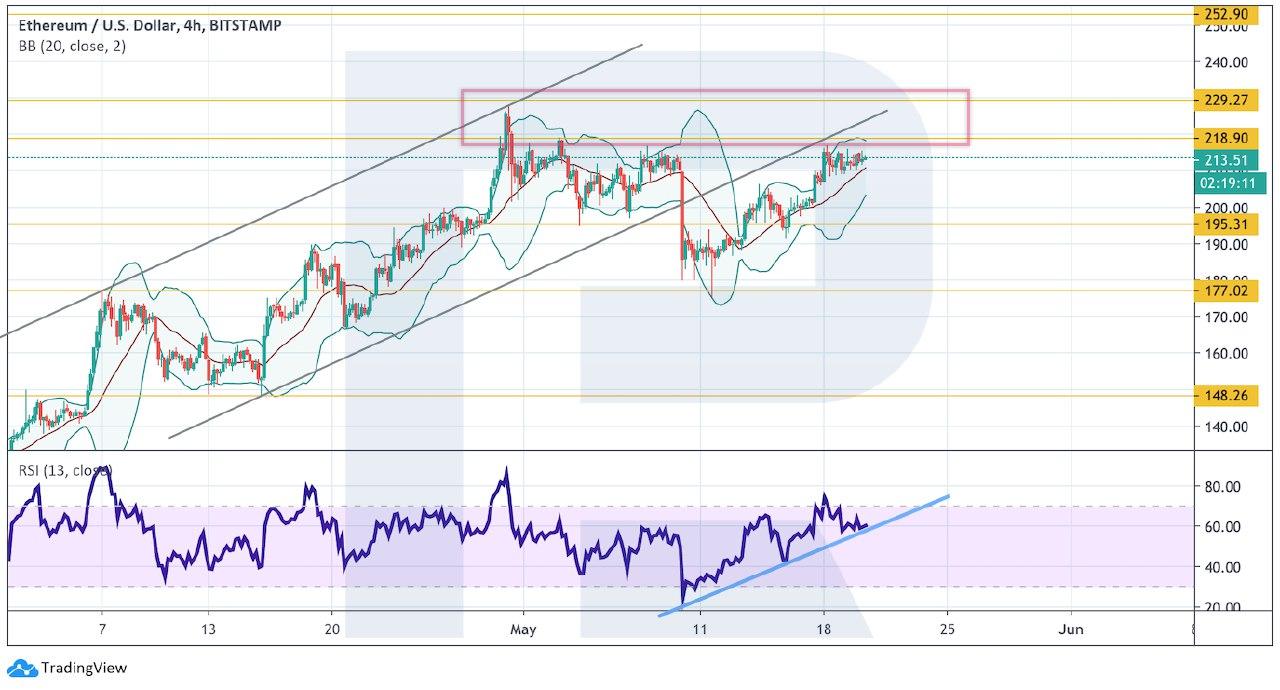
Photo: Roboforex / TradingView
Litecoin
In the daily chart, LTC/USD is rebounding from the support level; however, risks of further decline remain. A strong signal in favor of this idea is a formation of a “Head & Shoulders” reversal pattern at the RSI. Another signal to confirm further decline will be a breakout of the support line at the RSI and fixation below 40. In this case, the downside target may be at $25. This bearish scenario may no longer be valid if the pair grows in the nearest future, breaks the resistance level, and fixes above $52. In this case, the instrument may cancel the pattern and continue trading upwards to reach the descending channel’s upside border at $65.
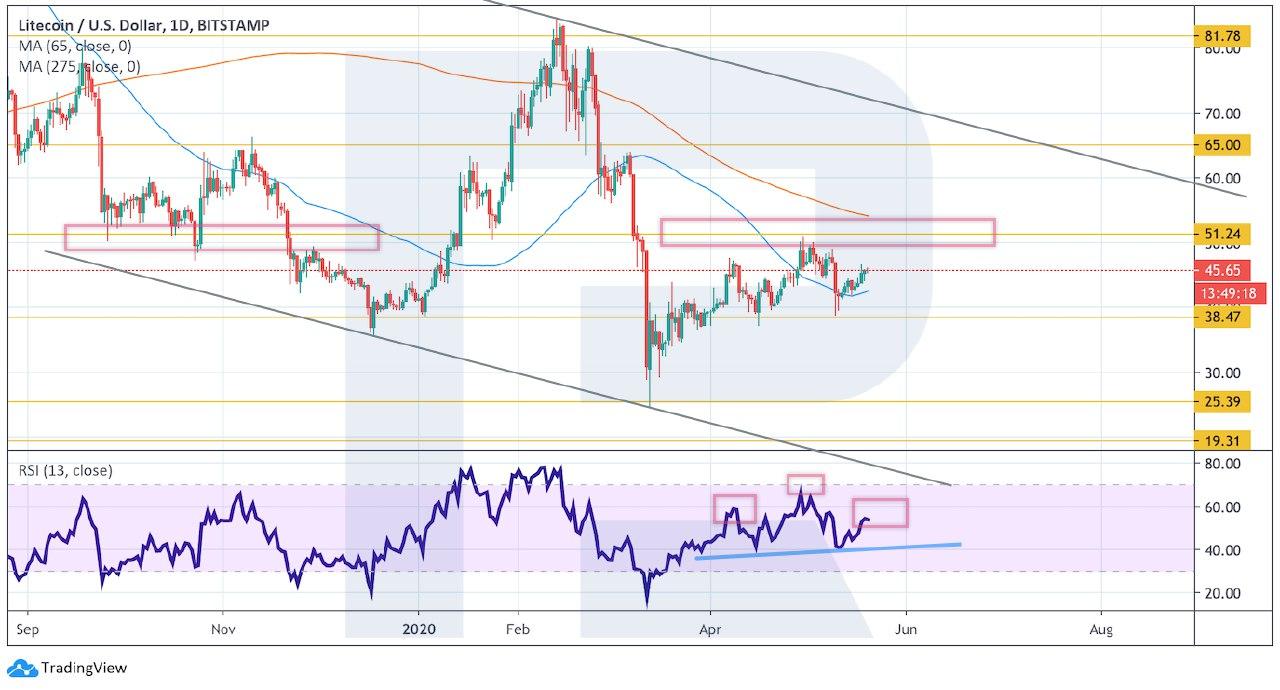
Photo: Roboforex / TradingView
As we can see in the h4 chart, there is a potential for the formation of a reversal pattern and a further decline towards $25. Later, the pair is expected to rebound from this level and resume falling to test $47, where it may finish the pattern. Another signal in favor of this idea will be a rebound from the rising channel’s downside border. However, this scenario may be canceled if the price skyrockets, breaks the local high, and fixes above $52. In this case, the instrument may continue trading upwards.
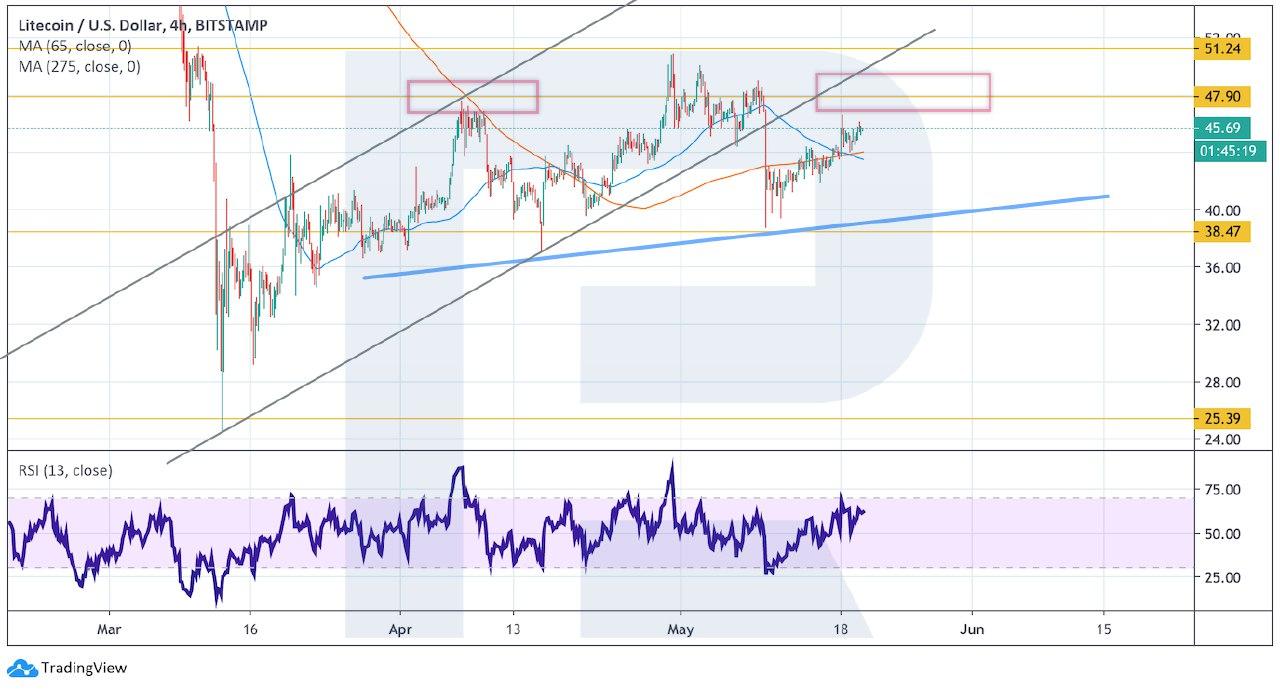
Photo: Roboforex / TradingView
Bitcoin Cash
As we can see in the daily chart, Bitcoin Cash hasn’t been able to break the resistance level. At the moment, there are chances to see a further decline with the target at $136. Another signal in favor of this idea is a rebound from the resistance line at the RSI. To confirm this scenario, the price must break the support level and fix below $197. In this case, the asset may break its long-term sideways channel. However, this scenario may no longer be valid if the instrument breaks the resistance level and fixes above $280. After that, the pair may continue growing to reach $355.
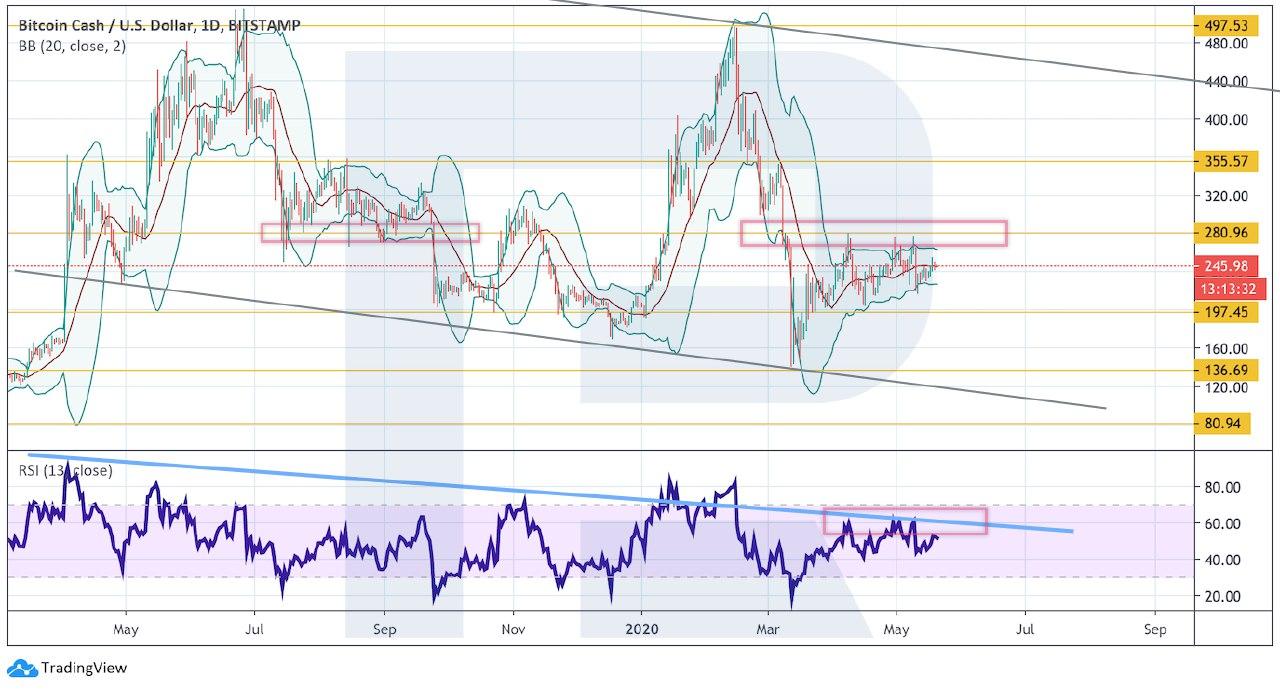
Photo: Roboforex / TradingView
In the H4 chart, BCH/USD is stuck inside a “Triangle” pattern. The RSI indicator has already rebounded from the resistance line, that’s why one may expect an attempt to break the pattern’s downside border and then a further decline towards $190. To confirm this idea, the pair must break the support level and fix below $219. However, if the instrument skyrockets and breaks $280, the asset may continue trading upwards.
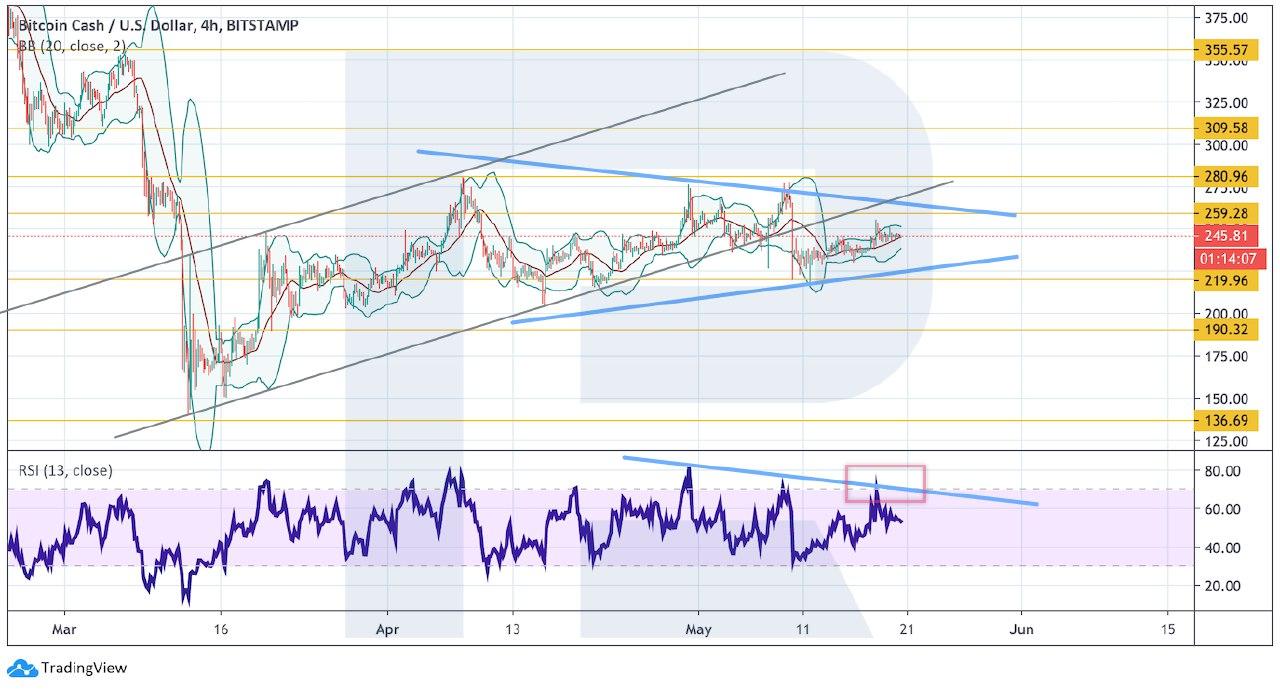
Photo: Roboforex / TradingView
EOS
EOS continues testing the rising channel’s downside border. There is a potential for a rebound and a further decline towards the target at $1.28. A strong signal in favor of this idea will be another rebound from the descending trendline at the RSI. To confirm a further decline, the pair must break the support level and fix below $2.09. However, this scenario may no longer be valid if the price breaks $3.18. In this case, the instrument may continue forming the bullish impulse to reach the target at $4.25.
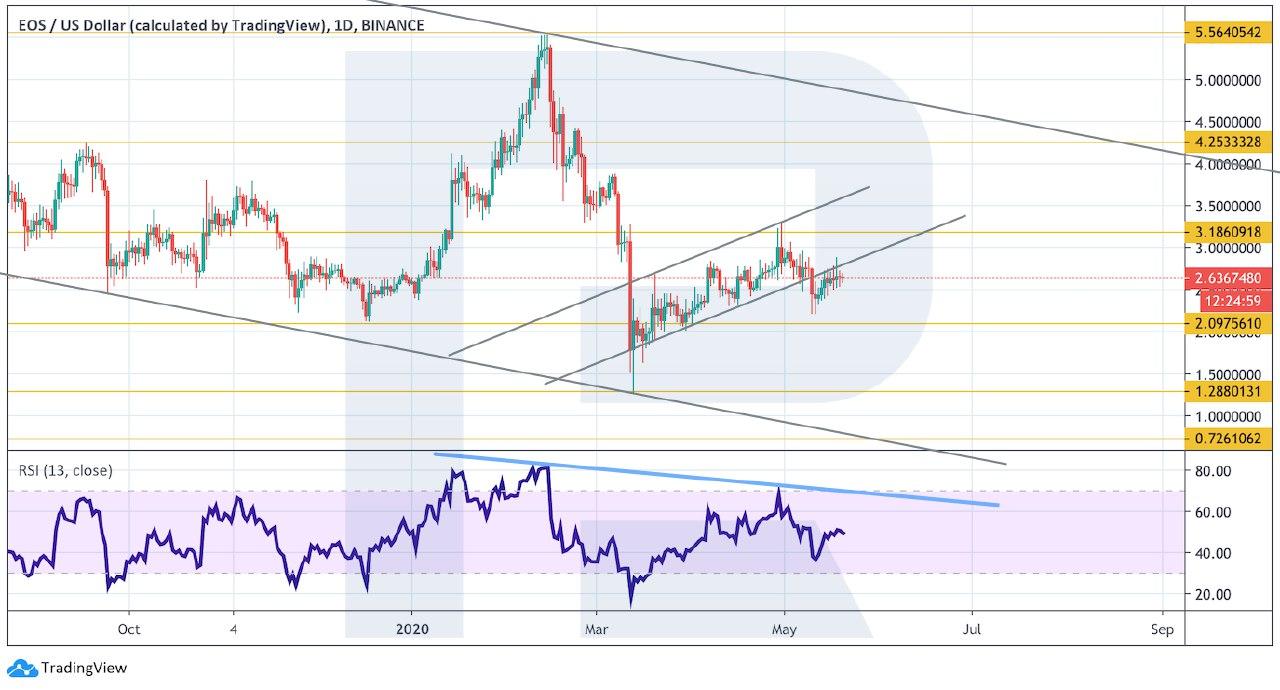
Photo: Roboforex / TradingView
As we can see in the H1 chart, the pair is falling inside the channel. There is a potential for a formation of a “Head & Shoulders” reversal pattern, that’s why after breaking $2.51, the price is expected to start falling and forming the pattern. Another signal in favor of this idea is a rebound from the resistance line at the RSI – we can see that during the test of the trendline the asset rebounded and didn’t move upwards. However, the bearish scenario may be canceled if the asset breaks the descending channel’s upside border and fixes above $2.80. In this case, the instrument may continue growing towards $3.14.
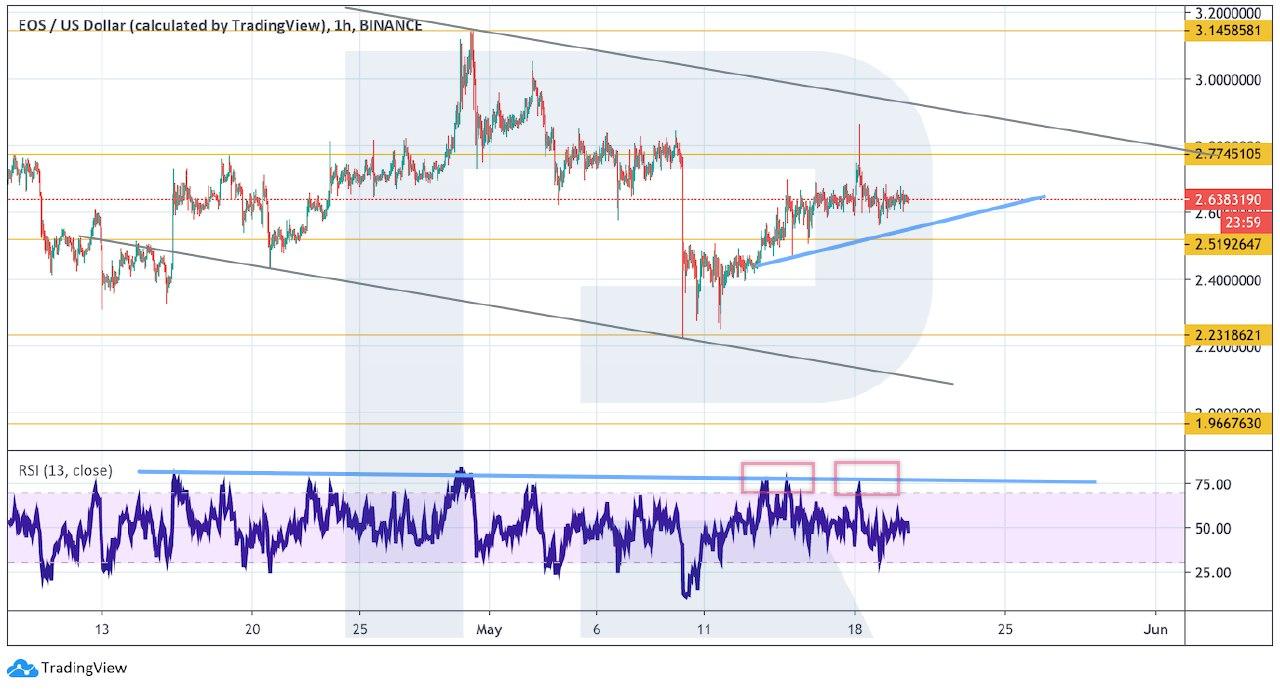
Photo: Roboforex / TradingView