Bitcoin Consolidates, but a Major Price Movement Is Underway
Bitcoin sits at a pivotal point in its trend that may define whether or not a new bull market is about to start.
Consolidating Within a No-Trade Zone
The bellwether cryptocurrency has been contained within a $1,500 trading range for the past month. This area is defined by the $8,500 support and the $10,000 resistance level.
Each time the flagship cryptocurrency has surged to the infamous $10,000 barrier, it gets rejected and pulls back to the $8,500 support wall. From this point, it bounces back up again.
As Bitcoin’s price action goes through a consolidation phase, the Bollinger bands on its 1-day chart were forced into a squeeze. Squeezes are indicative of periods of low volatility and are typically succeeded by wild price movements.
The longer the squeeze, the higher the probability of a strong breakout.
Since this technical indicator does not provide a clear path of Bitcoin’s direction, the area between the lower and upper band is a reasonable no-trade zone. A spike in volume that triggers a decisive move below or above this zone will determine the direction of the trend.
On the upside, the next significant resistance levels to watch out are represented by the 113%, 127.2%, and 141.4% Fibonacci retracement levels. These supply barriers sit at $10,800, $11,700, $12,500, respectively.
On the reverse, the most important areas of demand are provided by the 61.8%, 50%, and 38.2% Fibonacci retracement levels. Such support points lie around $7,700, $7,000, and $6,300, respectively.
Even though Bitcoin’s daily chart shows an ambiguous outlook, several on-chain metrics are leaning bearish.
Bitcoin Shows Bears on the Horizon
Ever since the bellwether cryptocurrency moved above $9,400 during the last day of April, its on-chain volume entered a downward trend. This metric has since plunged over 57%, going from $75 billion to recently reaching $32 billion.
Brian Quinlivan, Marketing and Social Media Director at Santiment, maintains that the steady decline in on-chain volume while prices have remained stagnant can be interpreted as a negative sign.
“This is a bit worrisome, as bounces typically don’t come to fruition unless there is some maintained or rising volume accompanying it. We definitely would advise caution here,” said Quinlivan.

Data shows that the total hashrate on the Bitcoin network dropped over 26% in the last two weeks.
Just before the recent block reward reduction event, the overall BTC hashrate spiked to around 122 TH/s. After the halving, however, the processing power of the network has been plummeting.
Some analysts suggest that the massive supply shock that Bitcoin went through could have sent miners into capitulation.
Since production costs doubled and mid-generation miners are no longer profitable, all mining pools might be selling a significant number of their holdings to stay afloat and eventually upgrade their machines.

This might be why the number of addresses with millions of dollars in Bitcoin began dumping their holdings on the market.
Santiment’s “holders distribution” chart reveals that since May 14, the number of addresses with 1,000 to 10,000 BTC decreased by nearly 1%.
This drop may seem insignificant at first glance, but when considering that these whales hold between $9 million and $90 million worth of Bitcoin, a 1% decline can translate into $1.2 billion.

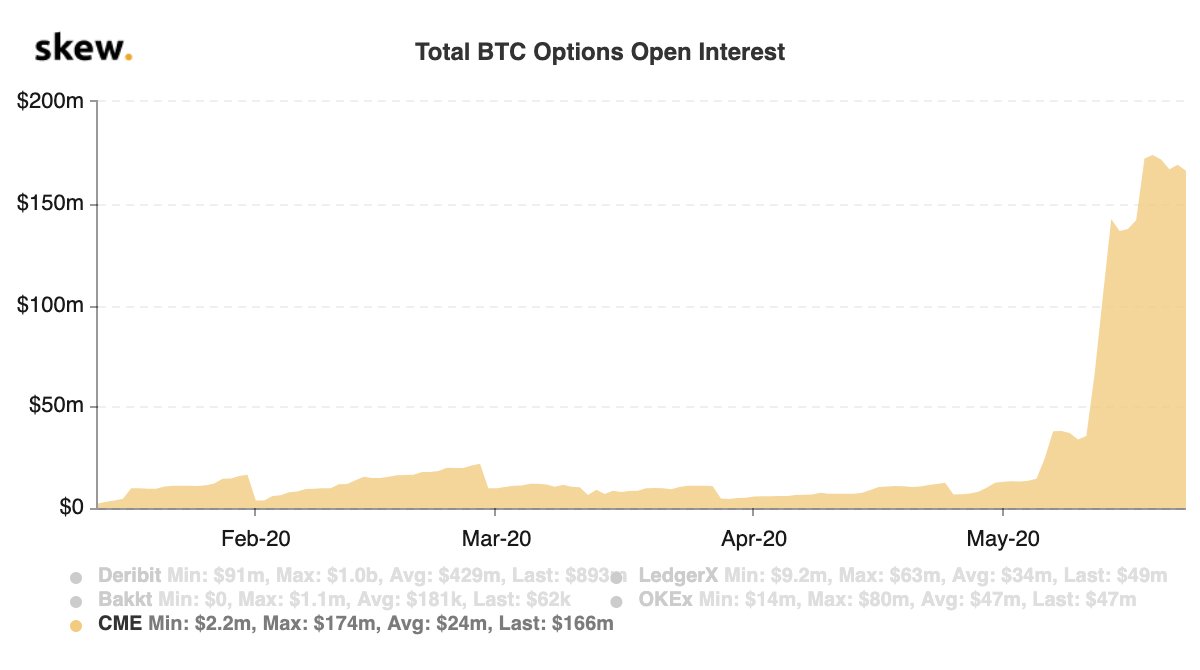
Moreover, Skew noted that 23,000 BTC worth of futures contracts and 10,000 BTC worth of options are set to expire on May 29. This large number of Bitcoin derivatives products represent roughly 50% of the open interest on the Chicago Mercantile Exchange (CME).
Since traders are expected to “roll over,” or sell the futures and options contracts, to switch from the ones that are close to expiration to other contracts later in the year, the event could trigger high volatility.
The selling pressure coming from these investors, combined with the miners capitulating, could have the potential to ignite a sell-off that is seen across the entire market.
But first, Bitcoin will have to close a daily candlestick below the $8,500 support level to validate such a pessimistic scenario.
FUD Ahead of Bitcoin
Since its inception, Bitcoin has managed to attract investors from every social class around the world.
This vote of confidence is reflected in BTC’s market capitalization, which is currently hovering around $170 billion.
While billionaires such as Paul Tudor Jones have made a reasoned argument that Bitcoin is a hedge against inflation and growing uncertainty in the global economy, others refuse to acknowledge its capabilities.
Goldman Sachs recently made the headlines after saying that Bitcoin is not an asset class since it does not generate cash flow like bonds and earnings through exposure to global economic growth.
“We believe that a security whose appreciation is primarily dependent on whether someone else is willing to pay a higher price for it is not a suitable investment for our clients. We also believe that while hedge funds may find trading cryptocurrencies appealing because of their high volatility, that allure does not constitute a viable investment rationale,” said Goldman Sachs.
Although there is an old saying that “any press is good press,” the multinational investment bank comments come at a time when Bitcoin sits above weak support.
It remains to be seen how these comments could impact prices, but for now, the area between $8,500 and $10,000 remains a no-trade zone.
The post Bitcoin Consolidates, but a Major Price Movement Is Underway appeared first on Crypto Briefing.