Crypto Price Analysis July 15: BTC, ETH, LTC, XRP, EOS
Coinspeaker
Crypto Price Analysis July 15: BTC, ETH, LTC, XRP, EOS
Dmitriy Gurkovskiy, a senior analyst at foreign exchange broker RoboForex, provides his vision of the possible tendencies in price changes for Bitcoin as well as for other major cryptos.
Of course, any serious movement will start only after the assets break these sideways ranges. However, one can already see the formation of signals in favor of further downtrends on daily charts of such assets as Ethereum, Litecoin, XRP, EOS, and Bitcoin Cash. If they break these channels to the downside, it may result in new waves of significant decline. On the other hand, the daily chart of Bitcoin hasn’t shown any downward signals so far but the unwillingness of the entire cryptocurrency market to rise may also indicate that bulls in Bitcoin are pretty weak.
Bitcoin
In the daily chart, Bitcoin is still moving below the downside border of a Triangle pattern, thus indicating bearish pressure and potential of a further decline towards $7,425. To confirm this idea, the asset must break the support area and fix below $8,600 – as we can see, the pair hasn’t broken this level before. In general, the cryptocurrency is moving inside the range. As a rule, when the price breaks such a range, the target may be at the distance equal to the width of the range. In our case, if Bitcoin fixes below $8,600, the next downside target may be at $6,320. However, the bearish scenario may no longer be valid if the market breaks the upside border of the range and fixes above $10,355.
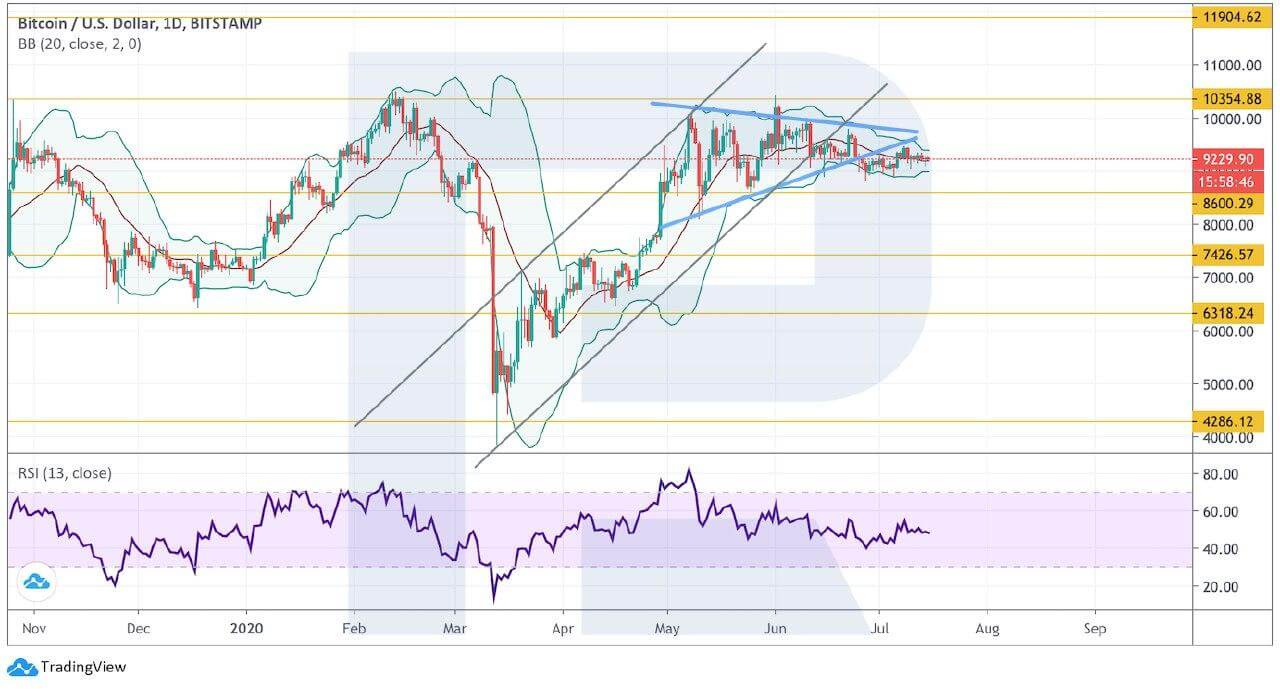
Photo: RoboForex / TradingView
As we can see in the H4 chart, Bitcoin is still correcting within the descending channel. There is a potential for the formation of a Head & Shoulders pattern in favor of a further decline. That’s why, after the asset breaks the support area and fixes below $8,860, it may complete the pattern and fall towards $8,250. Still, this scenario may be canceled if the price breaks the channel’s upside border and fixes above $9,530. In this case, the above-mentioned pattern won’t be complete and the instrument may continue growing towards $10,355.
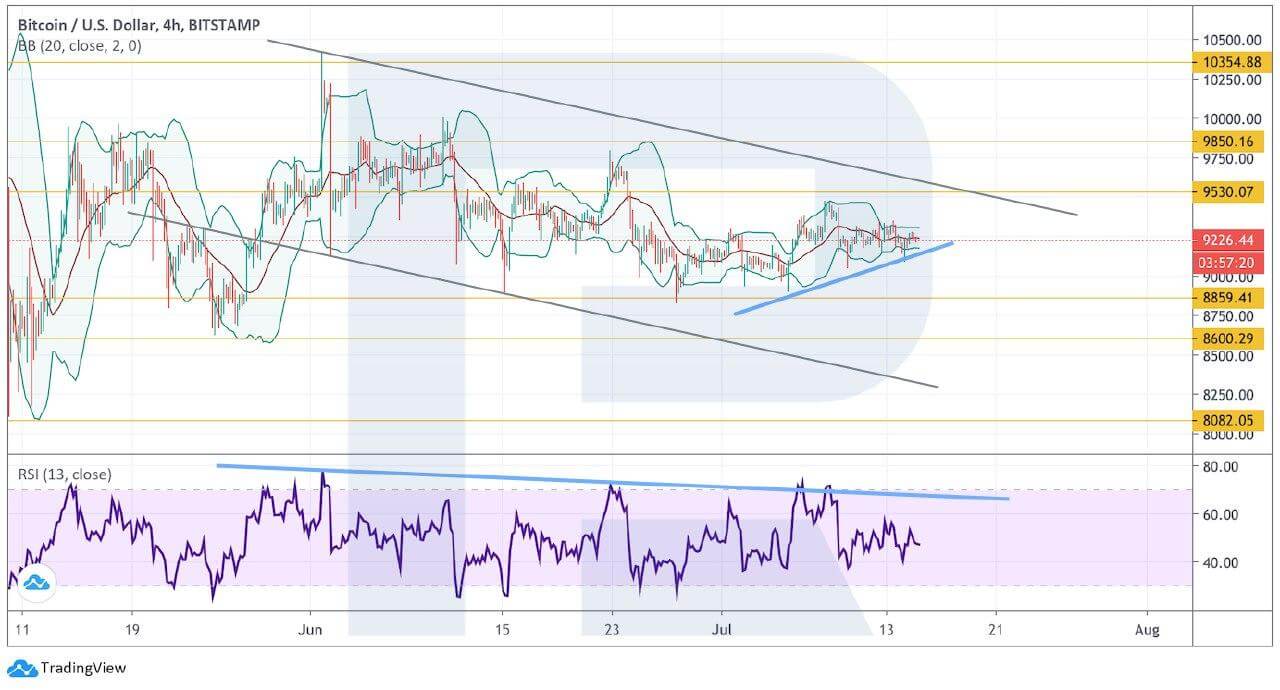
Photo: RoboForex / TradingView
Ethereum
As we can see in the daily chart, ETH/USD is once again testing the descending channel’s upside border. As soon as the price fixes above $255, the asset may break the border and continue trading upwards to reach $287. However, the most probable scenario right now implies a rebound from the border and a further decline. A strong signal in favor of this idea is a rebound from the resistance line at the RSI. After breaking $218, the instrument may complete a Triple Top reversal pattern and continue forming the descending impulse towards $177.
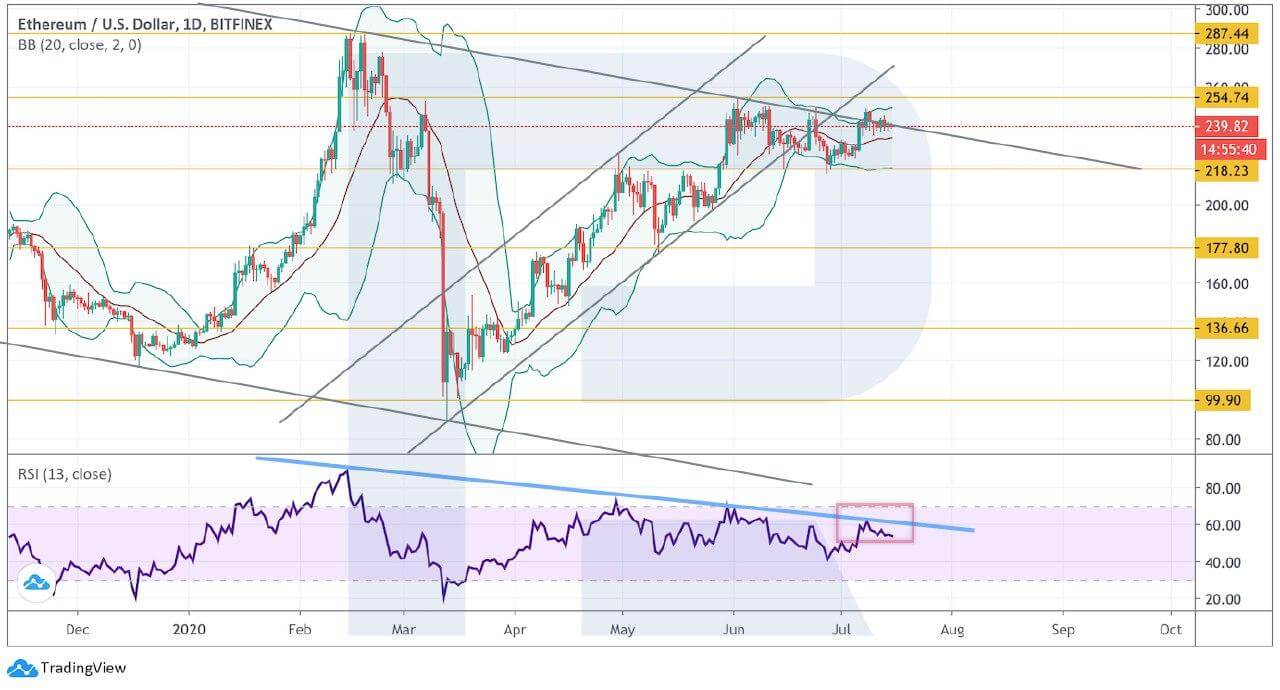
Photo: RoboForex / TradingView
On shorter timeframes, Ethereum is “stuck” inside a Triangle pattern. After breaking the support line, the RSI indicator has already tested it from below, that’s why there are chances to see a breakout of the pattern’s downside border and a further decline towards $218. To confirm this scenario, the asset must break the support area and fix below $233. However, this scenario may no longer be valid if the pair breaks the pattern’s upside border and fixes above $249. After that, the instrument may break $254 and continue forming the bullish impulse.
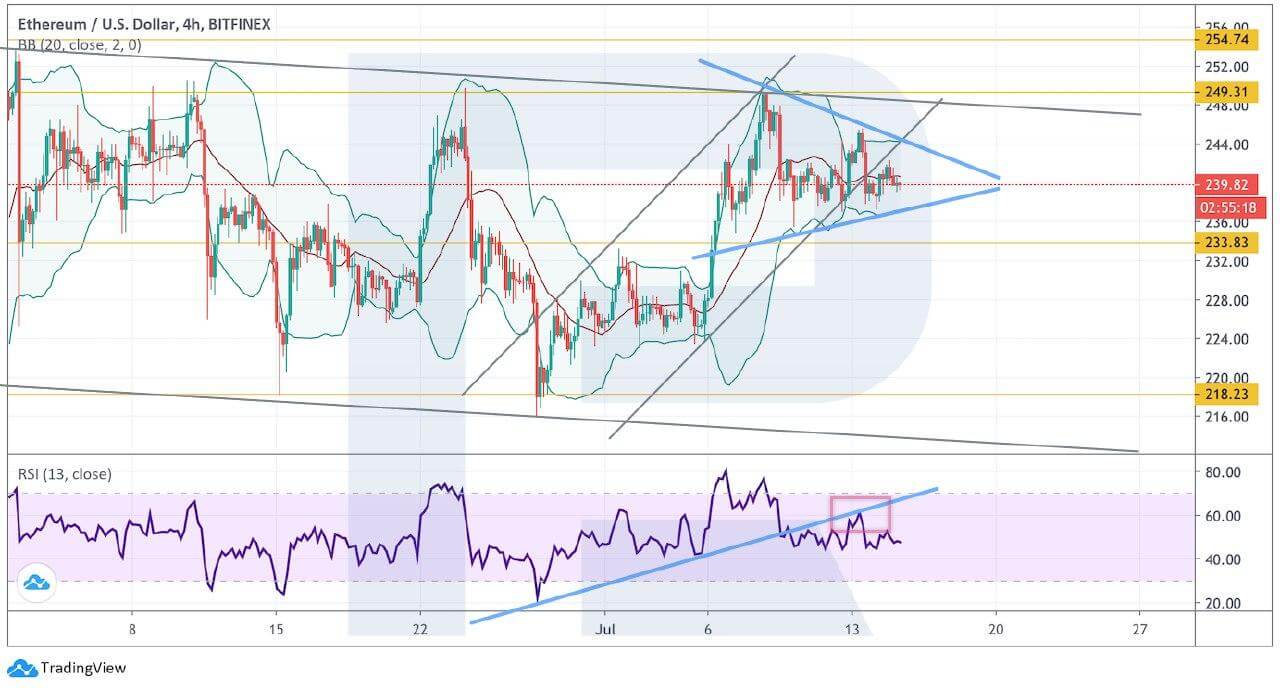
Photo: RoboForex / TradingView
Litecoin
In the daily chart, Litecoin is still correcting within a Triangle pattern, thus indicating some uncertainty until it leaves the pattern. The key trading idea implies an attempt to break the pattern’s downside border and continue falling with the first target at $28. A strong signal in favor of this scenario is another rebound from the resistance line at the RSI. As we can see, the indicator has failed to break it for the second time. Moreover, the current high was lower than the previous one at the moment of testing. Taken together, these factors indicate serious bearish pressure. However, to confirm this scenario, the instrument must break the support area and fix below $38.
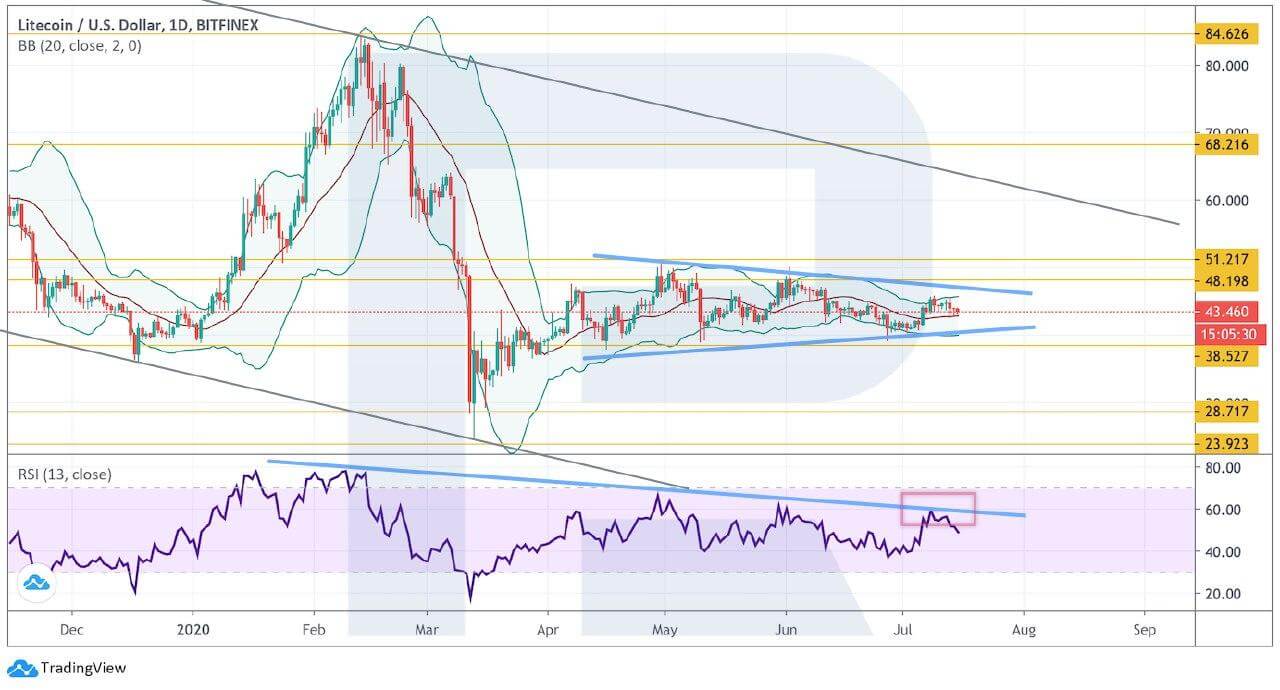
Photo: RoboForex / TradingView
As we can see in the H4 chart, LTC/USD is forming a Double Top reversal pattern. To confirm a further decline and the start of completion of the pattern, the pair must break the support area and fix below $42. In this case, the price may continue falling towards $39. Another signal in favor of this idea is a breakout of the support line at the RSI. However, the bearish scenario may no longer be valid if the asset fixes above $46. After that, the instrument is expected to continue trading upwards to reach $49.
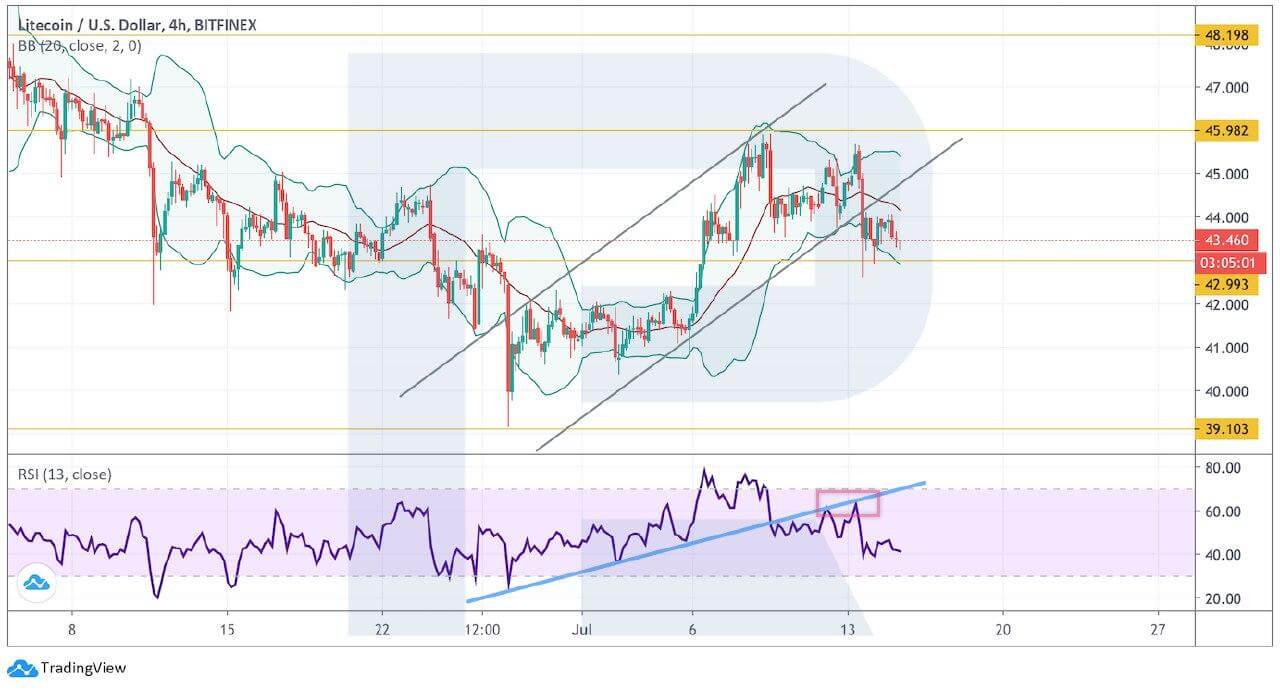
Photo: RoboForex / TradingView
XRP
In the daily chart, XRP is rebounding from the upside border of the Bollinger Bands indicator, thus showing a bearish pressure. Earlier, the price already rebounded and fell towards the indicator’s downside border in an attempt to break it. A strong signal in favor of a potential decline is a rebound from the resistance line at the RSI, which has failed to reach 70. Such a movement indicates a descending impulse and a bearish presence on the market. If the asset breaks the support area and fixes below $0.1685, it may continue falling towards $0.1180. However, such a negative scenario may no longer be valid if the pair breaks $0.2160. After that, the instrument may continue trading upwards to reach $0.2885.

Photo: RoboForex / TradingView
On shorter timeframes, the asset is “stuck” inside a Triangle pattern. However, the pair has already managed to break the rising channel’s downside border, that’s why one should exclude a possibility of a breakout of the pattern’s downside border as well. A signal in favor of this idea is a fixation of the RSI indicator below the ascending trendline. The downside target and the target of the pattern are at $0.1770. Still, this scenario may be canceled if the market breaks the pattern’s upside border and fixes above $0.2080. After that, the instrument may continue trading upwards to reach $0.2160 or even higher.
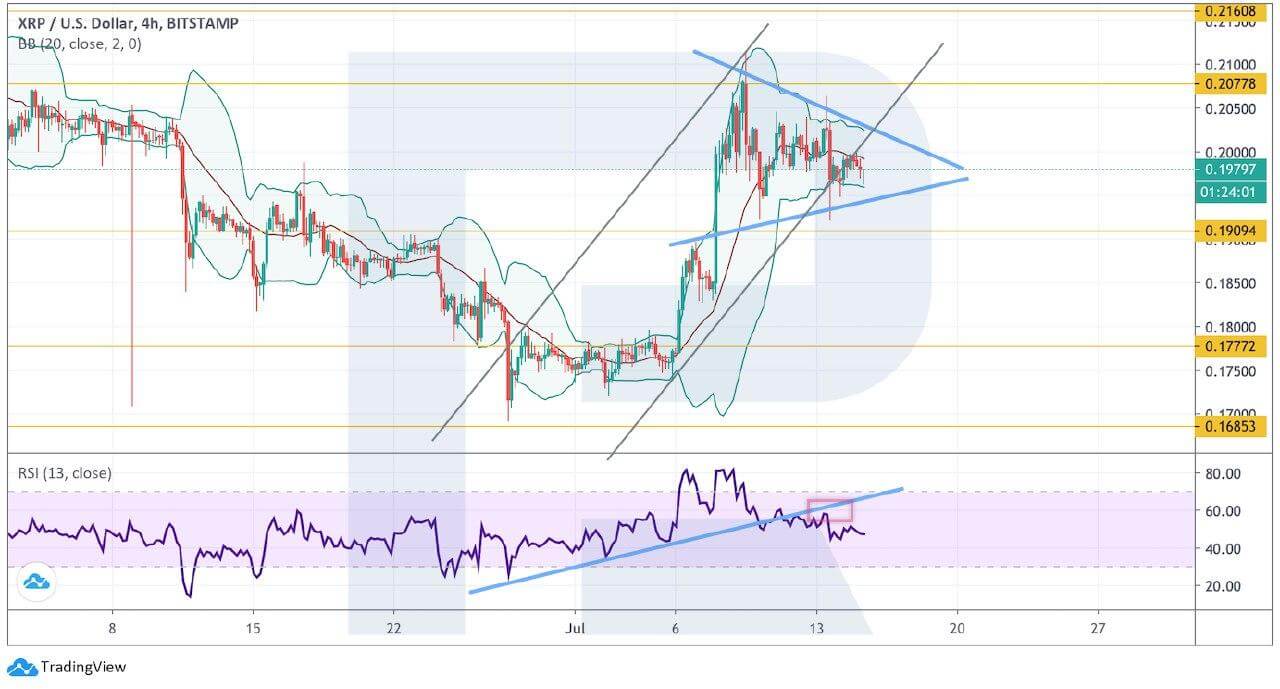
Photo: RoboForex / TradingView
EOS
As we can see in the daily chart, EOS is slightly falling within the descending channel. A strong signal in favor of a further decline towards the channel’s downside border is another rebound from the resistance line at the RSI. If bears are able to fix the price below $2.15, it may force a strong decline towards $1.32. As a rule, when the market breaks the descending channel to the downside, it’s a strong signal in favor of sales in any asset. However, the bearish scenario may no longer be valid if the cryptocurrency breaks $3.14. After that, the instrument may continue trading upwards with the target at $3.78.
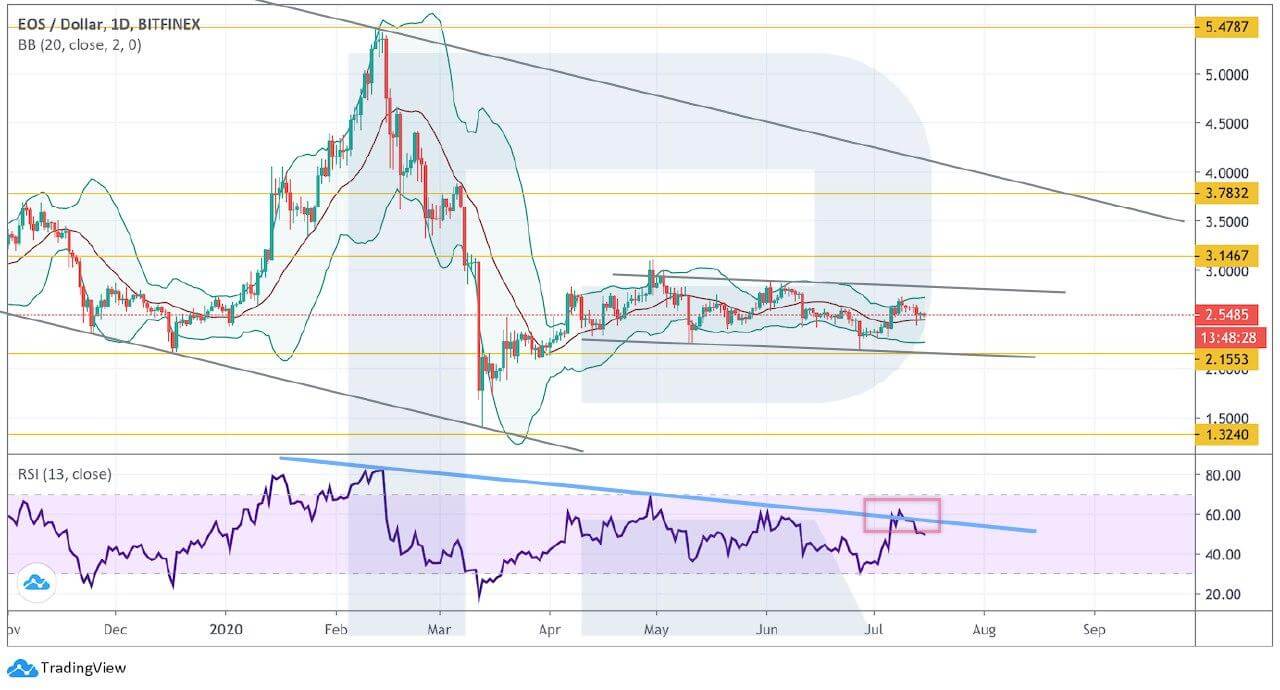
Photo: RoboForex / TradingView
In the H4 chart, the cryptocurrency has rebounded from the upside border of a “5-0” descending pattern. The target of the pattern materialization is at $2.15. Another signal in favor of a further decline is a breakout of the support line at the RSI. To confirm the bearish scenario, the price must break the support area and fix below $2.42. Still, this scenario may be canceled if the asset breaks $2.73. in this case, the instrument may continue growing to reach $2.91.
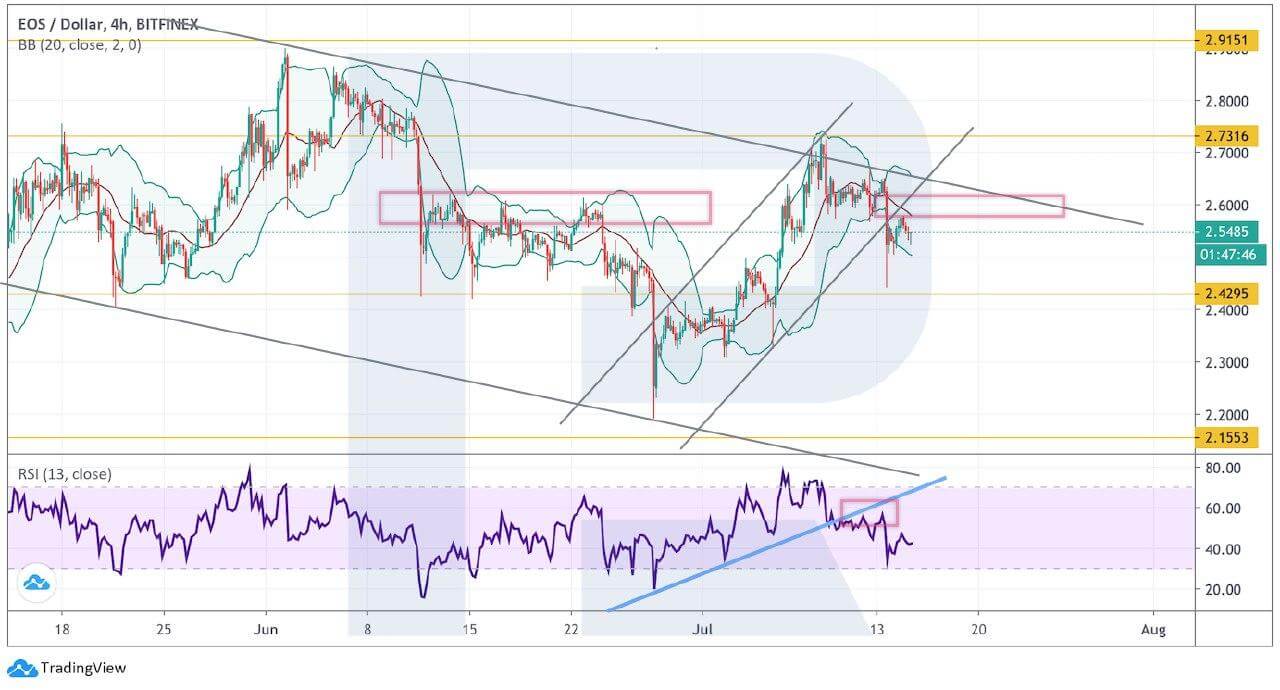
Photo: RoboForex / TradingView