Crypto Price Analysis July 29: Bitcoin Rose Above $11,000
Coinspeaker
Crypto Price Analysis July 29: Bitcoin Rose Above $11,000
Dmitriy Gurkovskiy, a senior analyst at foreign exchange broker RoboForex, provides his vision of the possible tendencies in price changes for Bitcoin as well as for other major cryptos.
The cryptocurrency market capitalization reached $320 billion. Altcoins are trying to keep pace with the “captain” of the industry but their dynamics are quite different. The Chicago Mercantile Exchange announced a record rally in trading volumes of BTC futures. The daily trading volume increased by 350% in comparison with the previous average numbers. An increase in activity and open position volume at the CME was caused by a “hurricane” growth of the Bitcoin rate. According to Skew, the daily trading volume in Bitcoin exceeded $40 billion. However, the all-time high of $50 billion, which was recorded on the “black Thursday”, March 12th, remains unbeaten so far. Open interest in BTC futures hit $5 billion.
Bitcoin
After some sort of revival on the cryptocurrency market, one should pay attention to long-term and mid-term tendencies. As a result, when one looks at the daily chart, they can see that Bitcoin has broken both the previous mid-term descending correction channel and the long-term resistance line. After updating important fractal highs, the asset may form a new rising channel. The mid-term upside target is the resistance line at $13,000. However, if we take a closer look, it can be seen that longer-term price movements are drawing an upside border and the upside target at $14,700. The support area may be at $9,745. The “Golden Cross” on MACD indicates a potential for a further rising tendency. After reaching the target, the asset may start a pullback towards the support line.
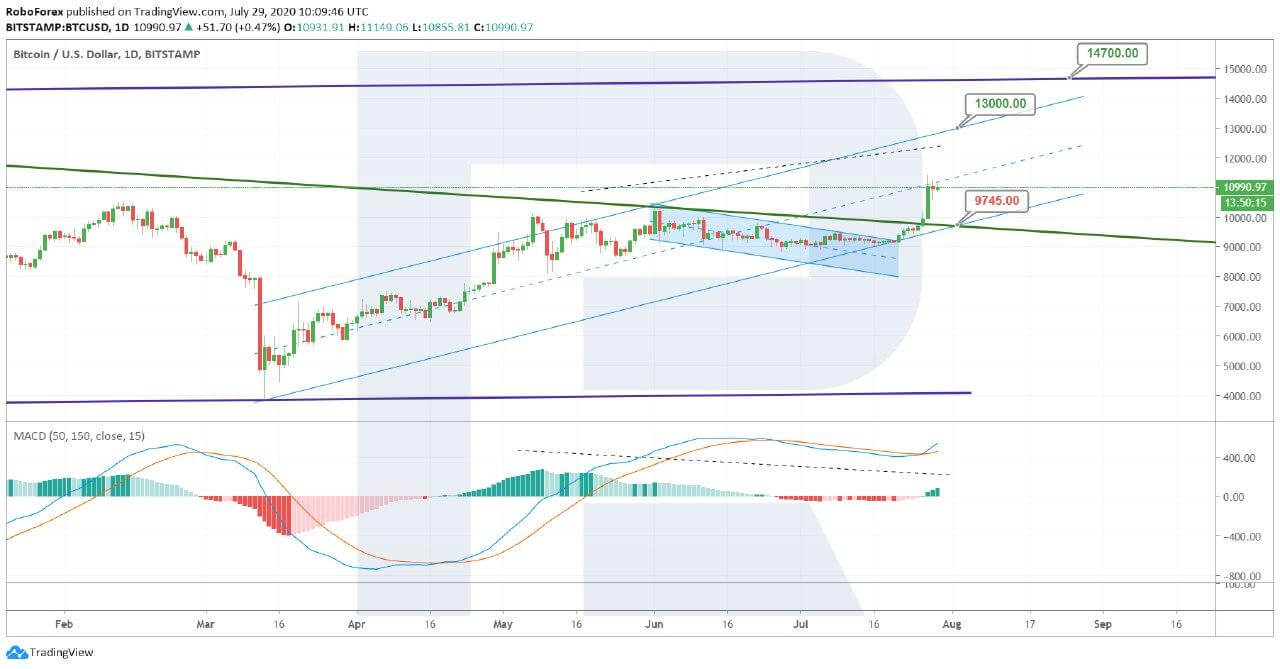
Photo: RoboForex / TradingView
The H4 chart of BTC/USD shows a more detailed structure of the previous ascending wave after a breakout of the resistance line and the “Golden Cross” on Stochastic Oscillator. At the moment, the rising impulse has slowed down to start a new correction in the form of a Triangle pattern. The potential of this correction implies that after reaching 23.6% fibo it may continue towards 38.2% and 50.0% fibo at $10,508 and $10,227 respectively. Signals for a start and a continuation of the correction are Stochastic Oscillator’s entering the “overbought area” and the following “Black Cross”.
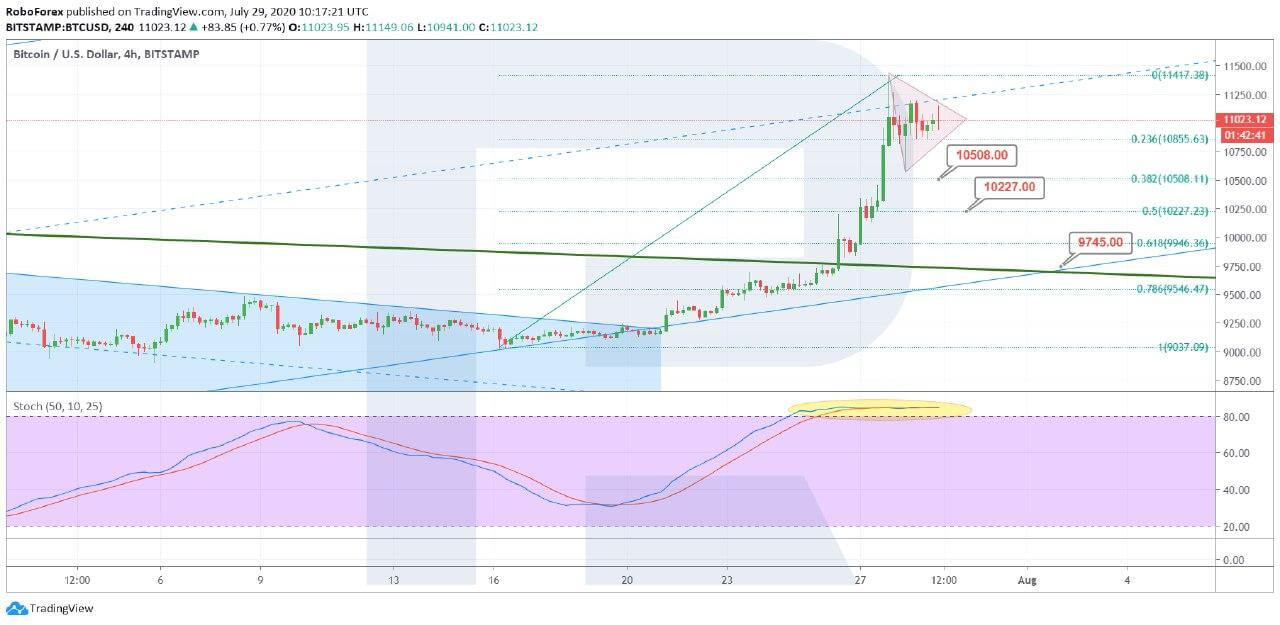
Photo: RoboForex / TradingView
Ethereum
As we can see in the daily chart, ETH/USD is forming an ascending tendency within a stable and almost perfect cannel. We should also note after a thorough test of the long-term resistance line, the asset has broken it. As a result, the pair is moving within an upside projected channel with the mid-term targets in the range between $400 and $420. However, the mid-term scenario implies that the price has equal chances for a rebound and a breakout of the resistance line. Still, judging by the MACD dynamics, a more probable scenario implies a breakout to the upside. The short-term support is at $283, while the ley one – $250.
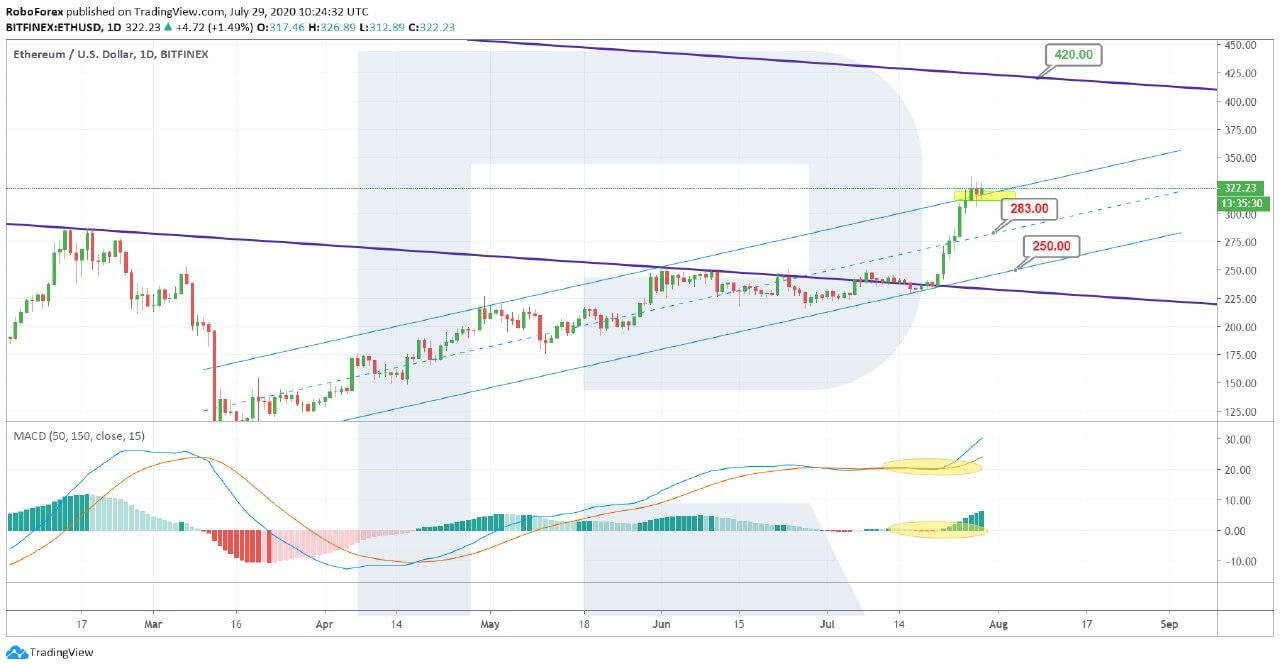
Photo: RoboForex / TradingView
In the H4 chart, Ethereum is correcting upwards and trying to form a Triangle pattern, which may later transform into something else. By now, the first correctional impulse has reached 23.6% fibo. The “Black Cross” on Stochastic Oscillator indicates a potential for a further decline towards 38.2% and 50.0% fibo at $293.47 and $281.12 respectively. After the asset breaks the high at $333.45, the instrument may complete the pullback and start a new growth to reach $360.
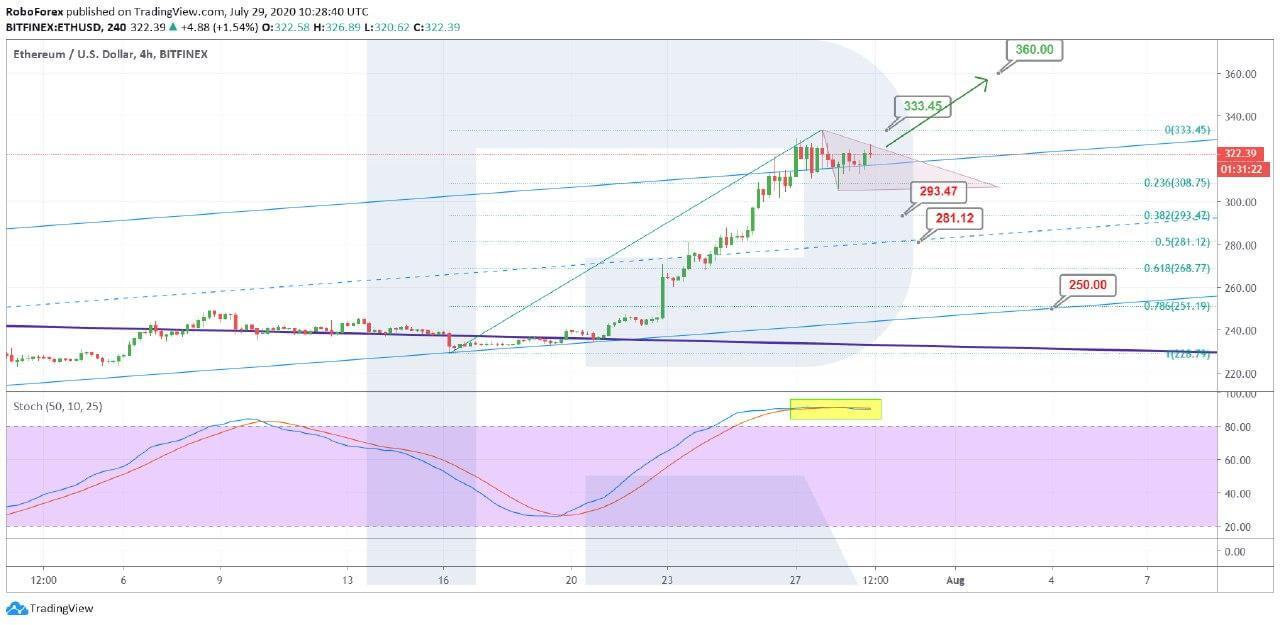
Photo: RoboForex / TradingView
Litecoin
After a revival of the cryptocurrency market, the daily chart of Litecoin shows that the asset is no longer moving within the previous consolidation range after breaking the long-term resistance line to the upside. $47.90, which was broken earlier, is now the support level. The rising dynamics of the MACD indicator confirm a further uptrend. The closest target is at $62.50.
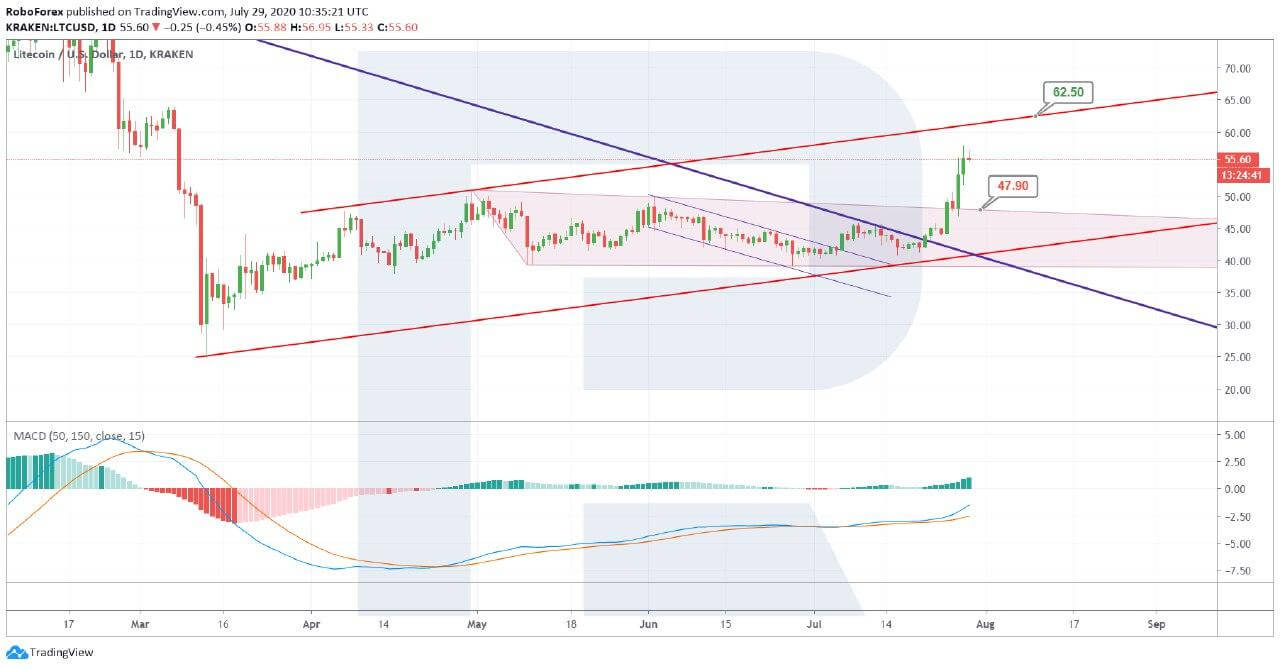
Photo: RoboForex / TradingView
In the H4 chart, LTC/USD is heading towards $61.50, which is located at the mid-term resistance line. In addition to that, we can see that the asset has stopped close to the resistance line of the short-term channel, while Stochastic Oscillator is about to form the “Black Cross” within the “overbought area”, which may indicate a new pullback. The key correctional targets maybe 23.6% and 38.2% fibo at $53.78 and $51.39 respectively.
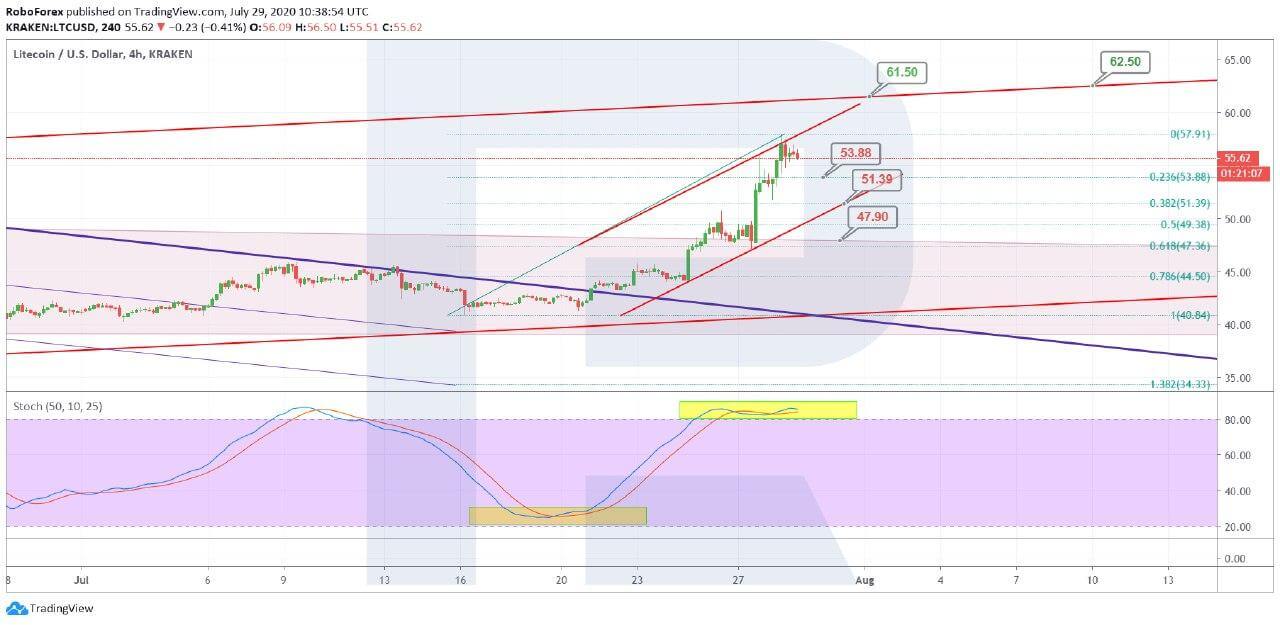
Photo: RoboForex / TradingView
Bitcoin Cash
From the technical point of view, the daily chart of Bitcoin Cash shows a new uptrend after the asset rebounded from both long- and mid-term support levels. After breaking the previous correctional channel to the upside, the pair may grow towards $355. The current support is at $255, which was broken earlier. If the market is strong enough to break the local resistance line and fix above $355, the instrument may continue trading upwards to reach $484, which is located at the long-term resistance level. Despite the fact that the MACD indicator is moving upwards quite steadily, there haven’t been any confirmations of a breakout of the current resistance. The long-term support is at $150.
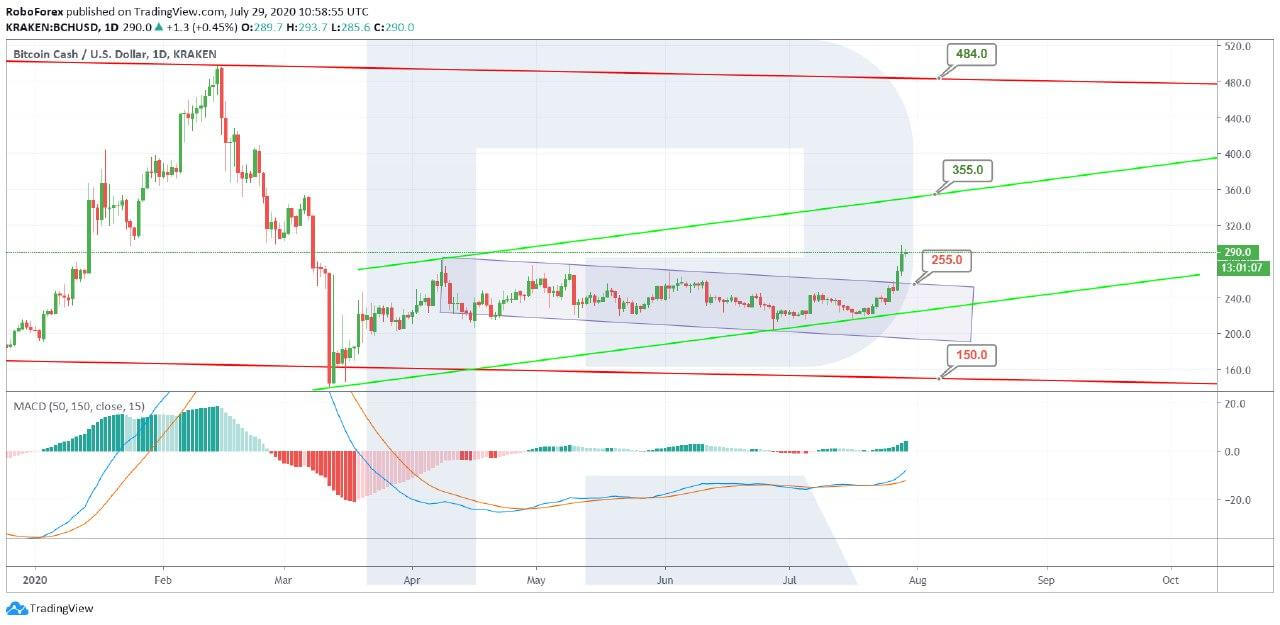
Photo: RoboForex / TradingView
Looking at the H4 chart of BCH/USD, we can say that Stochastic Oscillator’s entering the “overbought area” indicates a possible correction soon but the asset may yet continue trading upwards as long as there is no “Black Cross” on the indicator. If the “Black Cross” appears, the market may start falling towards 23.6%, 38.2%, and 50.0% fibo at $278.8, $267. 0, and $257.6 respectively.
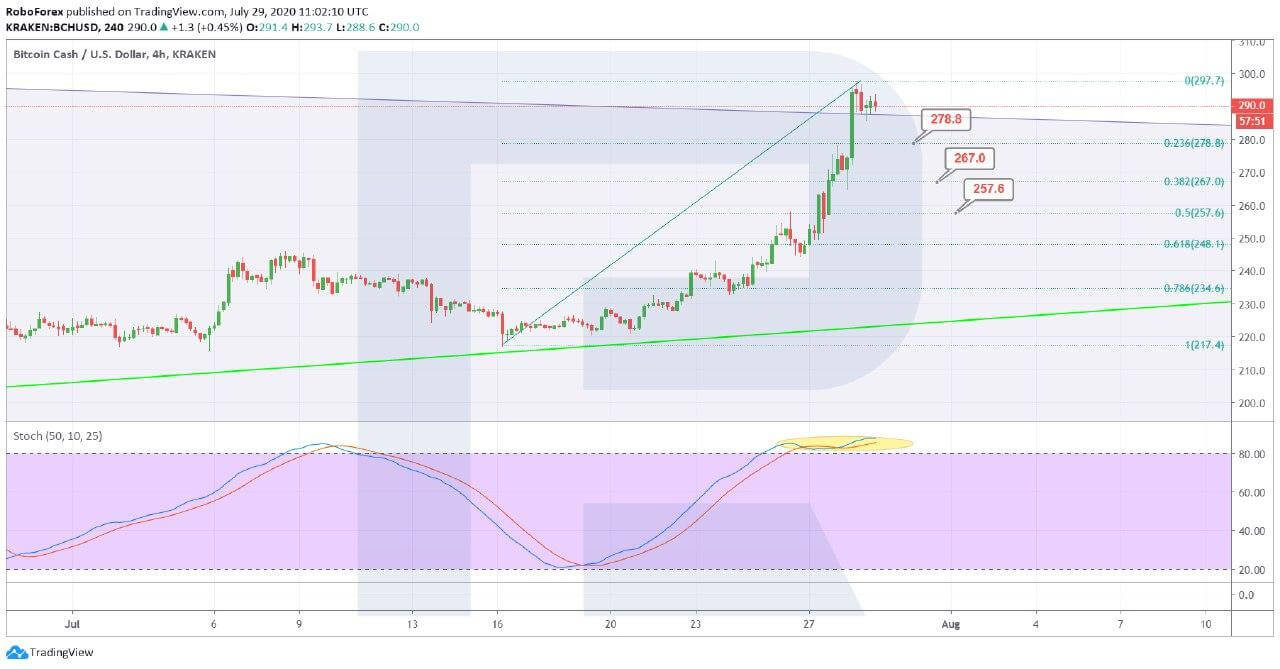
Photo: RoboForex / TradingView
EOS
As we can see in the daily chart, EOS is rising slowly but steadily; it has already broken the upside border of the consolidation range and right now is heading towards the long-term resistance at $3.42. After breaking it, the asset may rise higher and reach $3.85. Later, the market may correct downwards to test the broken long-term resistance line from above. In the nearest future, the price is trying to fix above $3.00. However, if it fails, the cryptocurrency may fall towards the local support at $2.70. Still, the stable rising dynamics on MACD may signal a further uptrend.
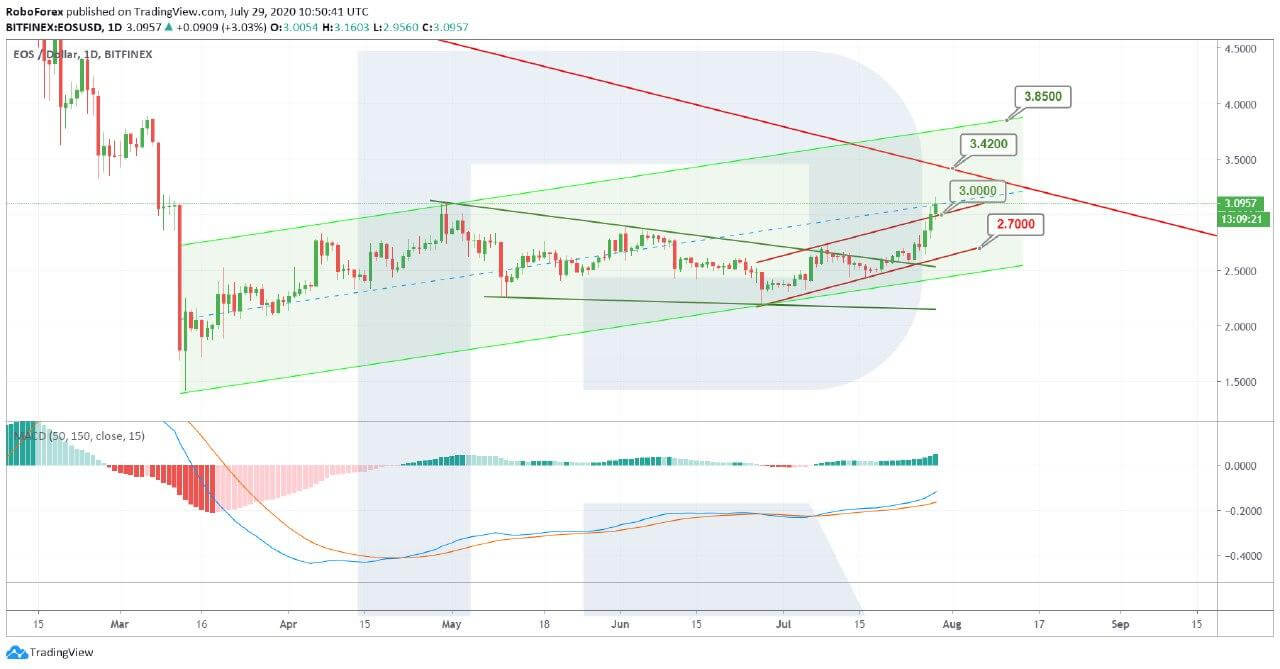
Photo: RoboForex / TradingView
The H4 chart of EOS, just like other instruments, shows a possibility of a new pullback, which is indicated by Stochastic Oscillator’s entering the “overbought area”. The potential targets of this pullback maybe 23.6% and 38.2% fibo at $2.98 and $2.88 respectively. Another signal in favor of a deeper correction will be a decline below $3.00. However, if the asset breaks the high at $3.16, it may reach $3.42.
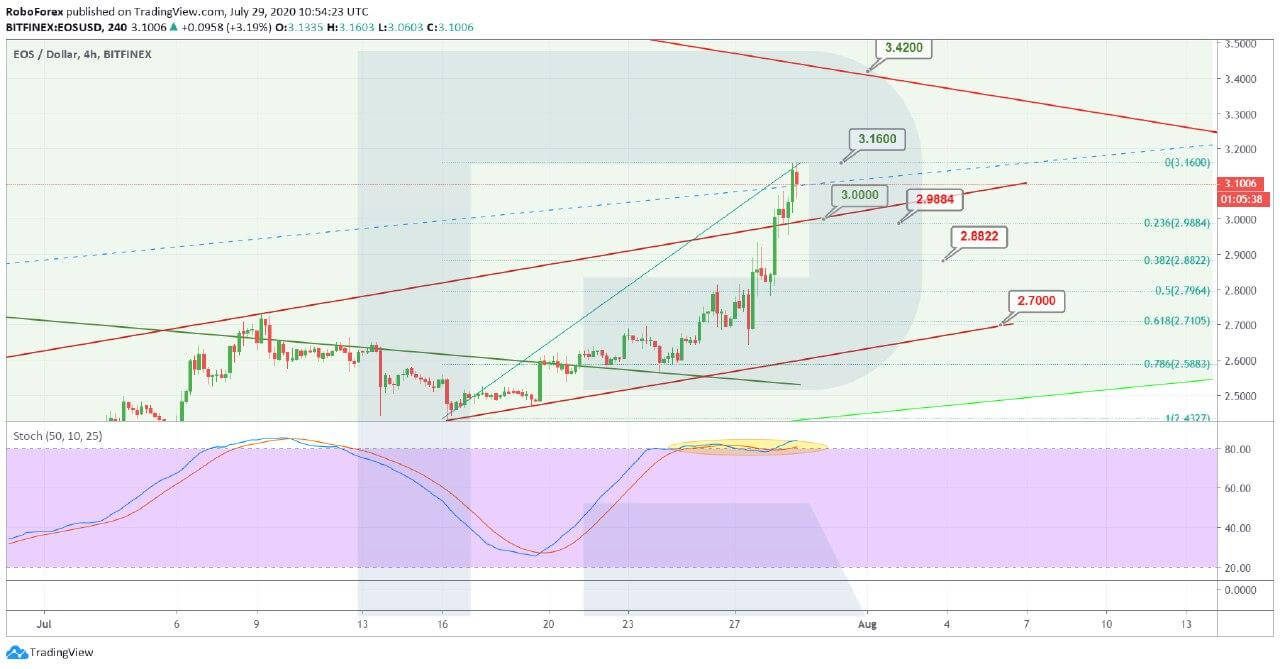
Photo: RoboForex / TradingView