Crypto Price Analysis August 12:
Coinspeaker
Crypto Price Analysis August 12:
Dmitriy Gurkovskiy, a senior analyst at foreign exchange broker RoboForex, provides his vision of the possible tendencies in price changes for Bitcoin as well as for other major cryptos.
Cryptocurrencies are still correcting before another attempt to start a new bullish impulse. In charts of many cryptoassets, they are forming a Triangle pattern, a breakout of which to the upside may lead to the continuation of the current trend. However, if bulls do not state their willingness to continue pushing the price upwards in the nearest future, the cryptomarket may continue the descending correction. In general, from the technical point of view, the market is ready to continue rising but any trend must “breathe”, that’s why the current descending movement is a natural part of any tendency.
Bitcoin
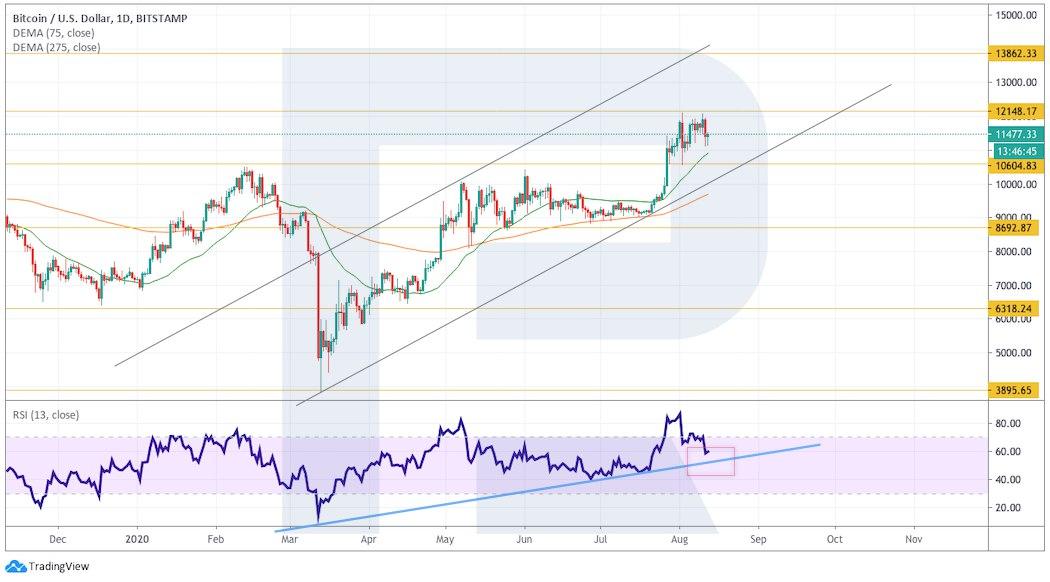
As we can see in the daily chart, Bitcoin is still correcting not far from a strong resistance area at $12,150. The closest support level is at $10,605. The RSI indicator has almost tested the support line, which might have resulted in another growth. One shouldn’t exclude a slight correction along with a test of the support area at $10,605, and then further growth with the predicted target at $13,865. However, this scenario may be canceled if the price breaks the rising channel’s downside border and fixes below $10,500. After that, the instrument may continue trading downwards to reach $8,690.
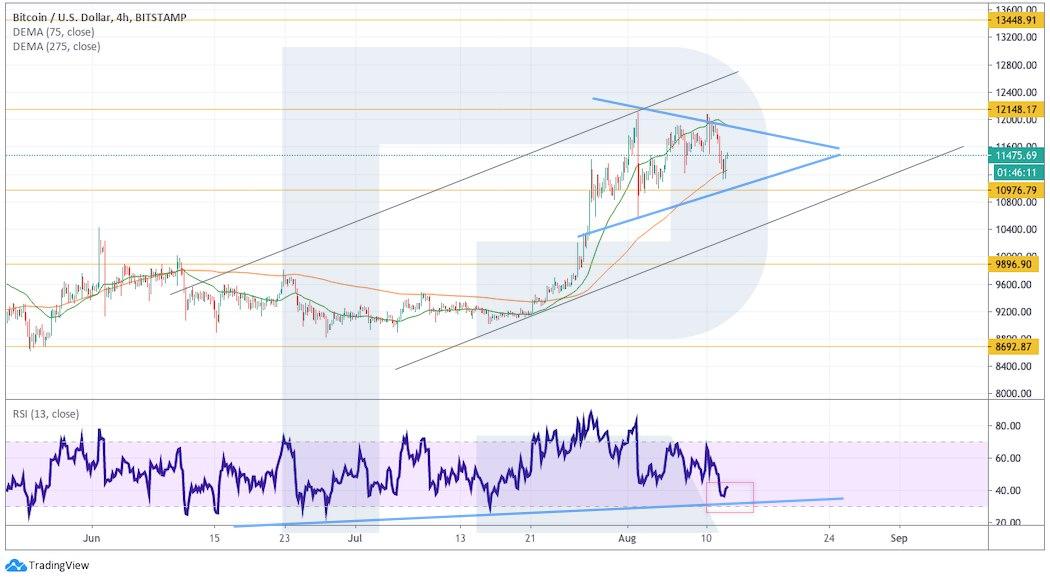
In the H4 chart, bulls haven’t been able to push the asset past the local high. The current movement is looking like a Triangle pattern. If the asset breaks the pattern’s upside border and fixes above $12,150, the instrument may grow to cover the distance equal to the pattern’s height. A good signal in favor of this idea will be a rebound from the support line at the RSI. The target of the pattern materialization is at $13,450. However, this scenario may no longer be valid if the instrument breaks the pattern’s downside border and fixes below $10,800. In this case, the market may continue falling towards $9,895.
Ethereum
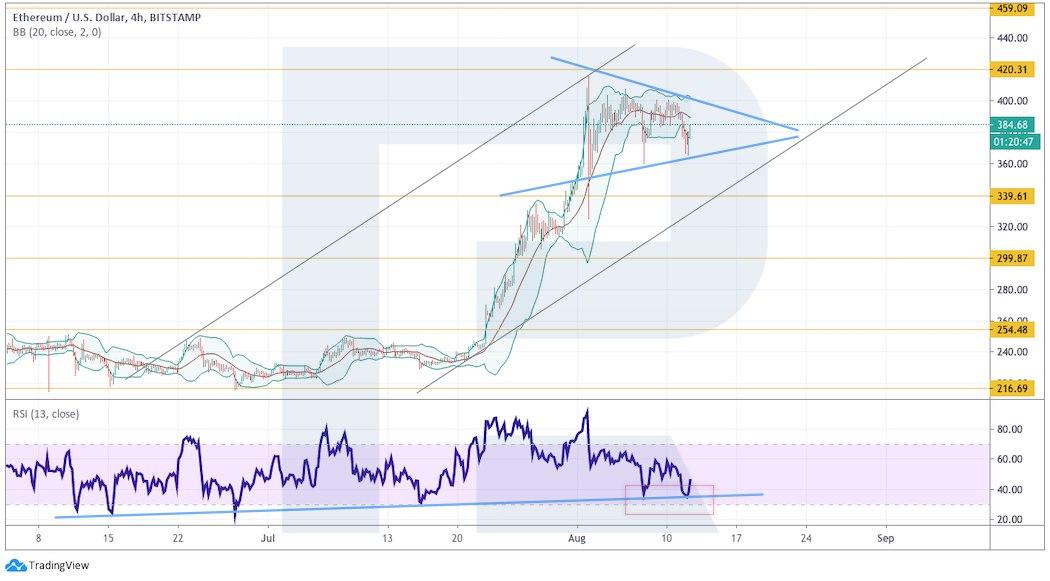
In the daily chart, ETH/USD is once again stuck inside a Triangle pattern. As a rule, the pattern is broken in the direction of the active trend. Here, the asset is moving above the rising channel’s upside border and that’s a strong signal in favor of further uptrend. To confirm this idea, the pair must break the pattern’s upside border and fix above $420. Another signal in favor of this scenario is a rebound from the support line at the RSI. As we can see, the previous test led to a price surge.
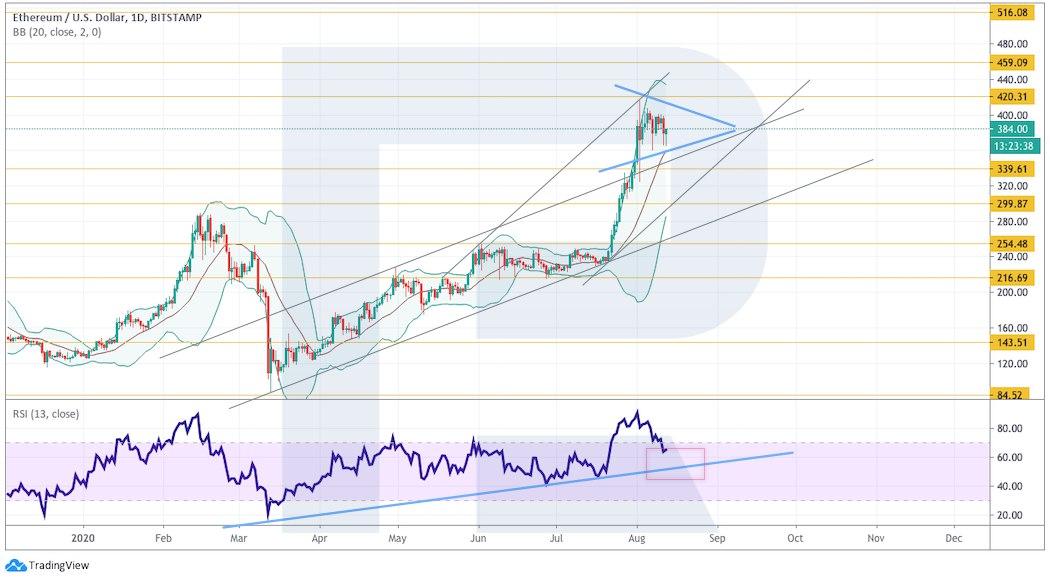
On shorter timeframes, the RSI is rebounding from the support line for the second time, thus indicating the formation of a Double bottom reversal pattern on the price chart. If the indicator breaks the resistance line and fixes above 60, the price chart may try to grow. However, the bullish scenario may be canceled if the cryptocurrency breaks the rising channel’s downside border and fixes below $340. After that, the instrument may continue falling to reach $300.
Litecoin
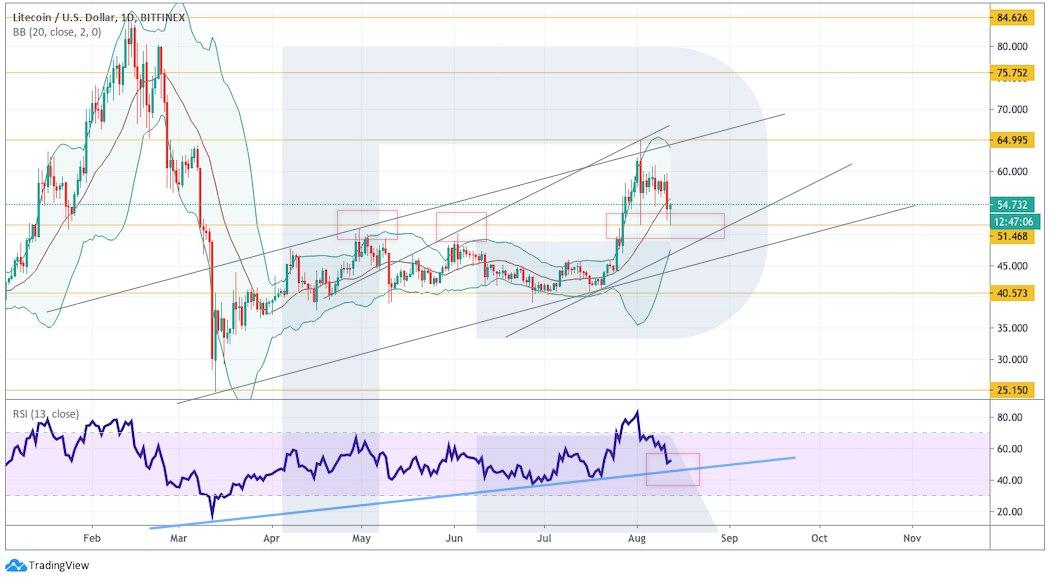
As we can see in the daily chart, Litecoin is still moving above the support line, which indicates a bullish pressure and the unwillingness of the market to deepen the correction. As long as the asset is moving above the support area, one should expect an attempt to start a new rising tendency. Another signal in favor of this idea will be a rebound from the support line at the RSI. After breaking $65, the pair may start a proper bullish trend with the target at $75. However, this scenario may no longer be valid if the price breaks the rising channel’s downside border and fixes below $45. In this case, the instrument may continue trading downwards to reach $40 or even lower.
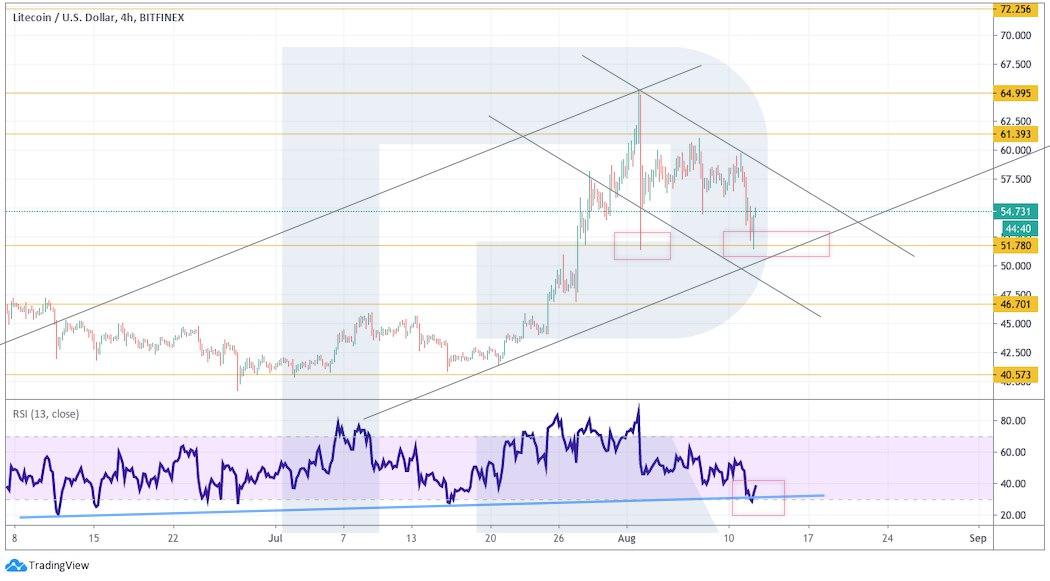
In the H4 chart, the cryptoasset is correcting within the descending channel. After breaking the channel’s upside border and fixing above $59.55, the instrument may continue growing with the target at $65 and then $72. A strong signal in favor of this idea is a rebound from the support line at the RSI. Still, this scenario may be canceled if the price breaks the rising channel’s downside border and fixes below $50. In this case, the market may continue falling to reach $40.55.
EOS
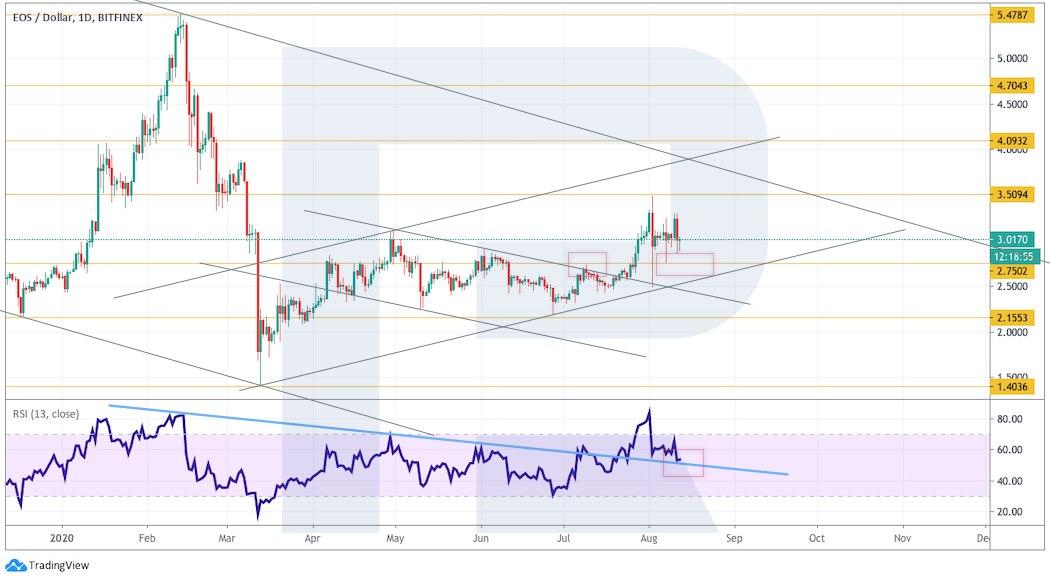
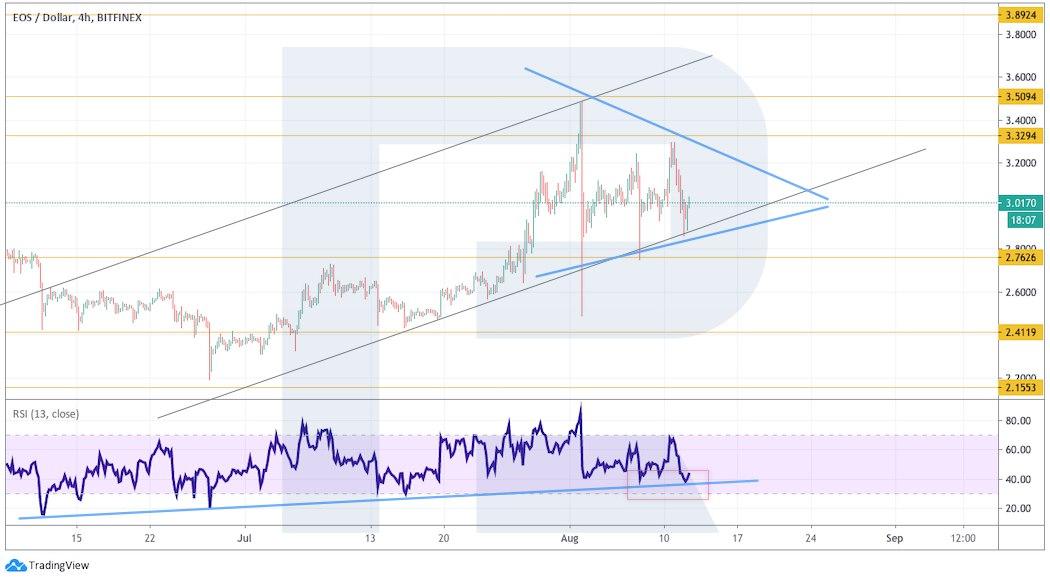
In the daily chart, EOS is still trading above the support level and may continue trading upwards with the first target at $3.50. Another signal in favor of this idea is a rebound from the trendline at the RSI: as we can see, after a breakout, the indicator returned to re-test the line. However, this scenario may no longer be valid if the price breaks the rising channel’s downside border and fixes below $2.50. After that, the instrument may continue falling to reach $2.15.
As we can see in the H4 chart, the cryptocurrency is stuck inside a Triangle pattern. The RSI indicator is rebounding from the support line for the second time, thus hinting at a possible breakout of the pattern’s upside border. To confirm this idea, the asset must break the pattern’s upside border and fix above $3.32. In this case, the market may continue growing to reach $3.90. Still, this scenario may be canceled if the instrument breaks the pattern’s downside border and fixes below $2.76. After that, the price may continue trading downwards with the target at $2.41.
XRP
As we can see in the daily chart, XRP is once again moving below the rising channel’s upside border, thus indicating bearish pressure. However, in order to continue the uptrend, the cryptocurrency must break $0.3315 to the upside again. Another signal in favor of this scenario is a test of the support line at the RSI. Still, this scenario may no longer be valid if the price breaks the support area and fixes below $0.2395. in this case, the instrument may continue trading downwards to reach $0.2160.
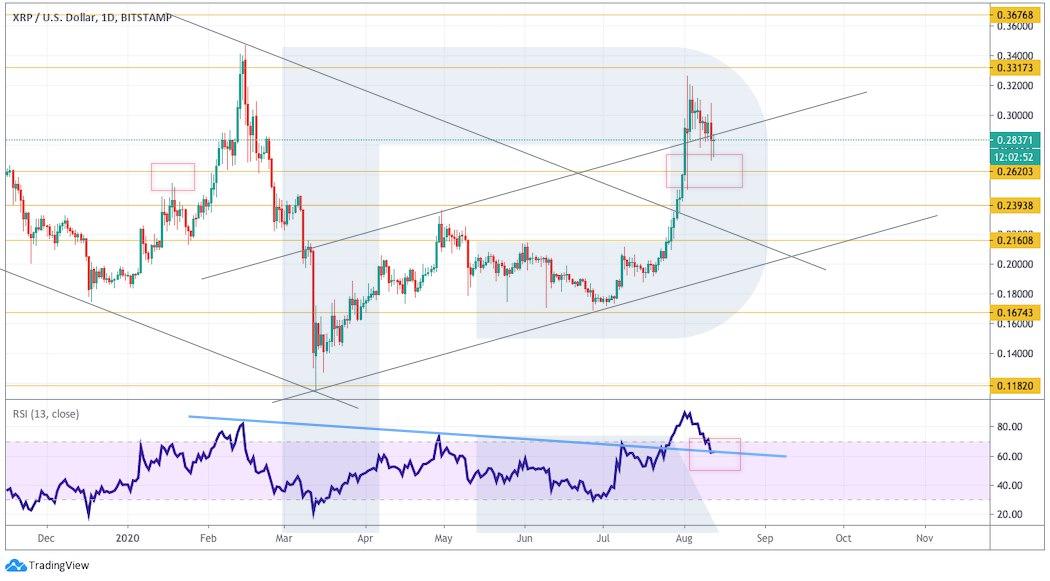
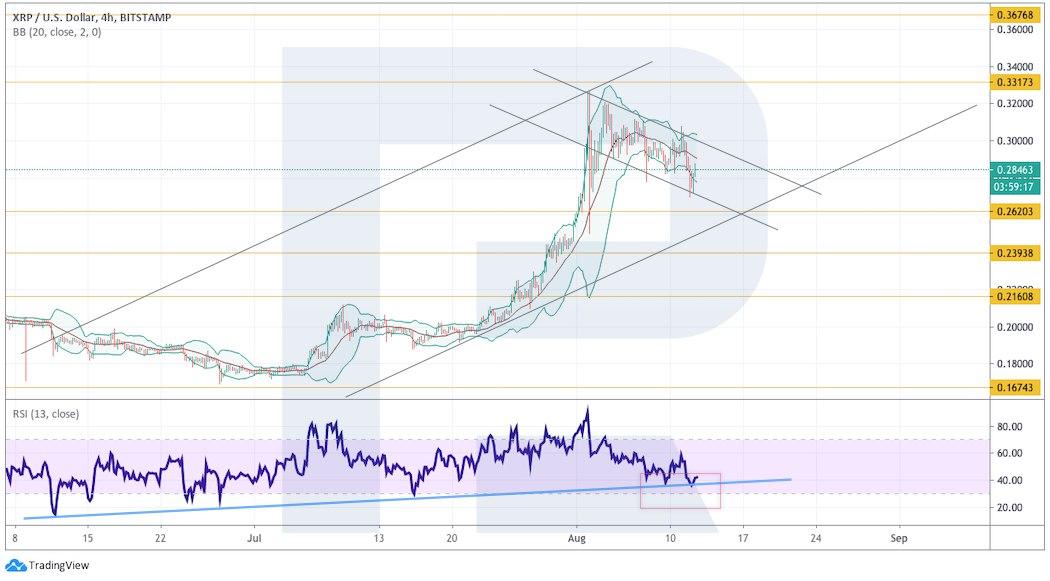
On shorter timeframes, the cryptocurrency is correcting within an ascending Flag pattern. After breaking the descending channel’s upside border and fixing above $0.3000, the asset may grow and complete the bullish pattern with the predicted target at $0.3675. Another signal in favor of this idea is a rebound from the support line at the RSI. However, this scenario may be canceled if the price breaks the rising channel’s downside border and fixes below $0.2620. After that, the instrument may continue falling with the target at $0.2160.