Crypto Price Analysis August 19: BTC, ETH, LTC, EOS, LINK
Coinspeaker
Crypto Price Analysis August 19: BTC, ETH, LTC, EOS, LINK
Dmitriy Gurkovskiy, a senior analyst at foreign exchange broker RoboForex, provides his vision of the possible tendencies in price changes for Bitcoin as well as for other major cryptos.
On charts of many assets, the currently forming structures point at further growth. So, if bulls continue their pressure, the cryptocurrency market may try to continue the bullish trend. The unwillingness of the market to rise actively after breaking Triangle patterns may be a little confusing but the overall picture remains in favor of bulls.
Bitcoin
In the daily chart, Bitcoin is correcting again. It should be noted that the price is still moving above the middle band of the Bollinger Bands indicator, thus confirming bullish pressure. An important support area is at $10,535. After testing this level, the asset may resume trading upwards with the predicted target at $14,230. Another signal in favor of this idea will be a rebound from the support line at the RSI. However, this scenario may no longer be valid if the cryptocurrency breaks the rising channel’s downside border and fixes below $9,810. In this case, the instrument may continue trading downwards to reach $7,870 and start a new descending correction.
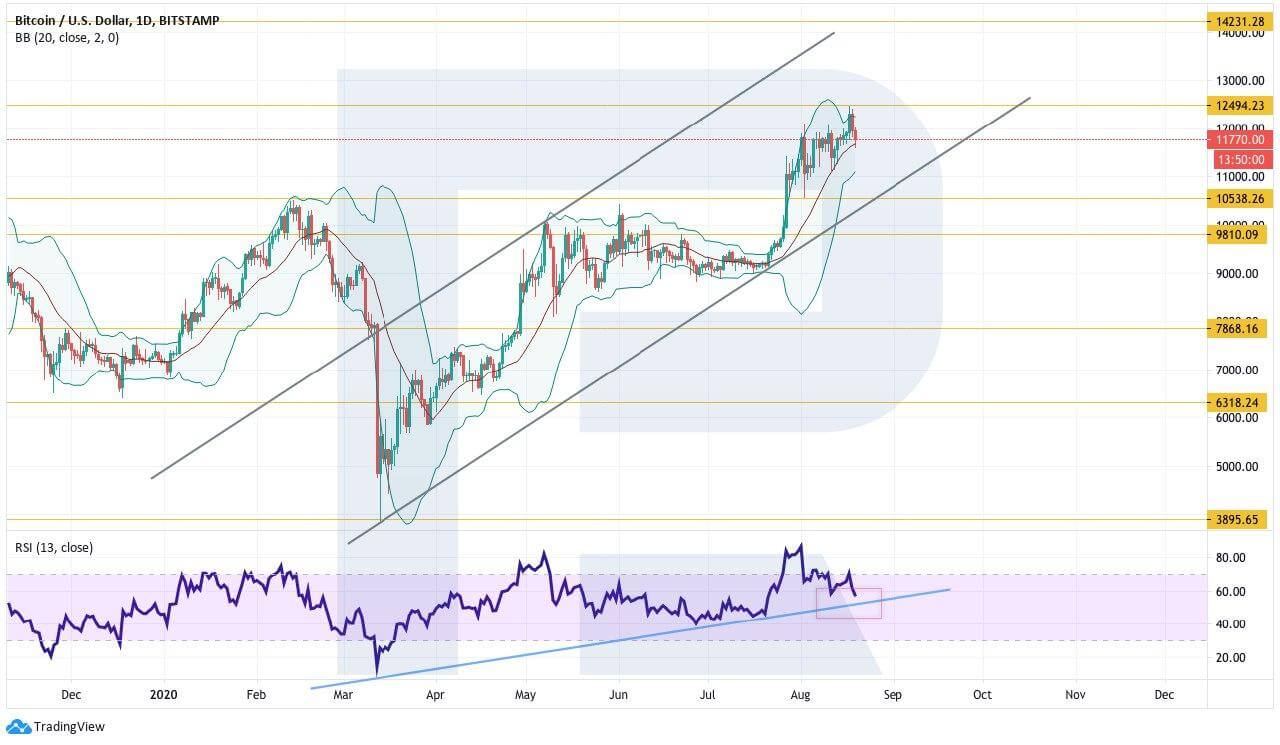
Photo: RoboForex / TradingView
As we can see in the H4 chart, BTC/USD has rebounded from the rising channel’s upside border. A good support area is at $11,225. After testing it, Bitcoin may form one more ascending structure towards $12,495. Here, the RSI indicator is also moving close to the support line and a rebound from the line will indicate further growth. Still, this scenario may be canceled if the asset breaks the rising channel’s downside border and fixes below $11,150. After that, the instrument may continue falling to reach $10,540.
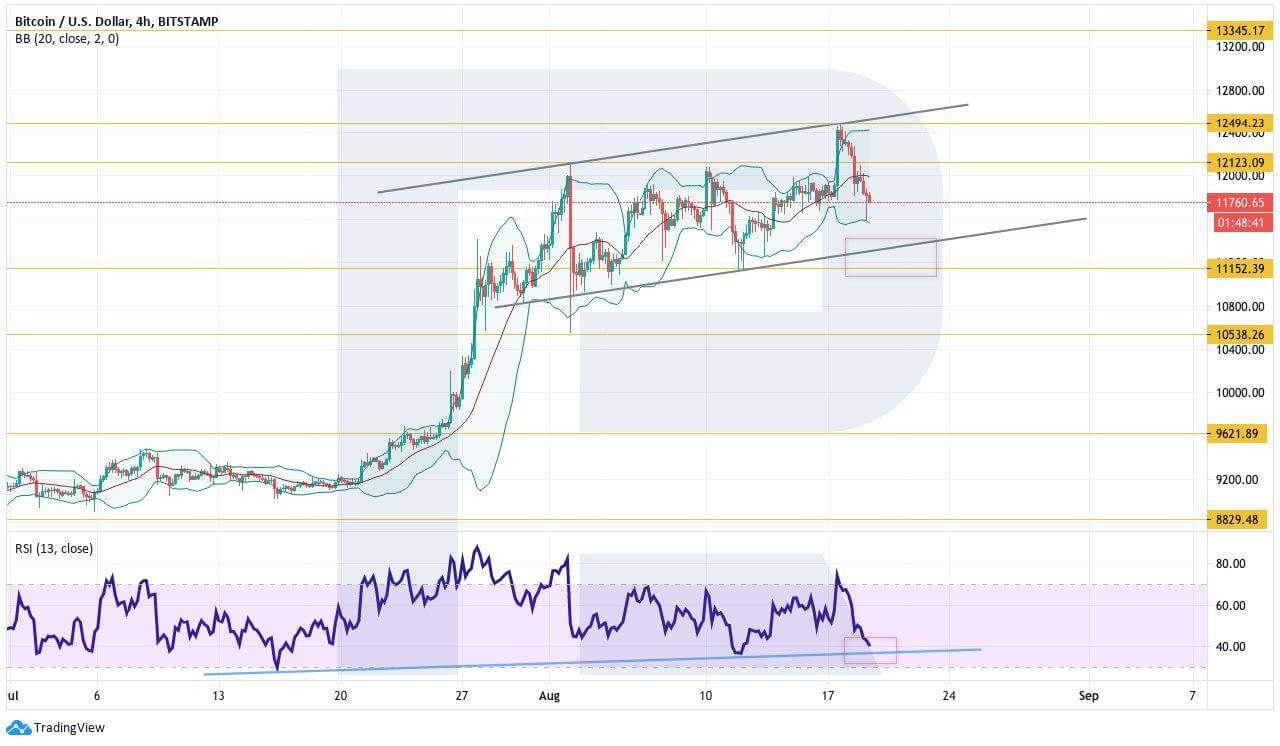
Photo: RoboForex / TradingView
Ethereum
As we can see in the daily chart, ETH/USD has updated its local high but right now it is correcting. A strong signal in favor of further decline was a breakout of the rising channel’s upside border, that’s why one shouldn’t exclude a possibility that the asset may return to the broken border at $360 and then resume moving upwards. In this case, there might be a rebound from the support line at the RSI. However, this scenario may no longer be valid if the cryptocurrency breaks $360. In this case, the instrument may get back inside the channel and fall towards $295.
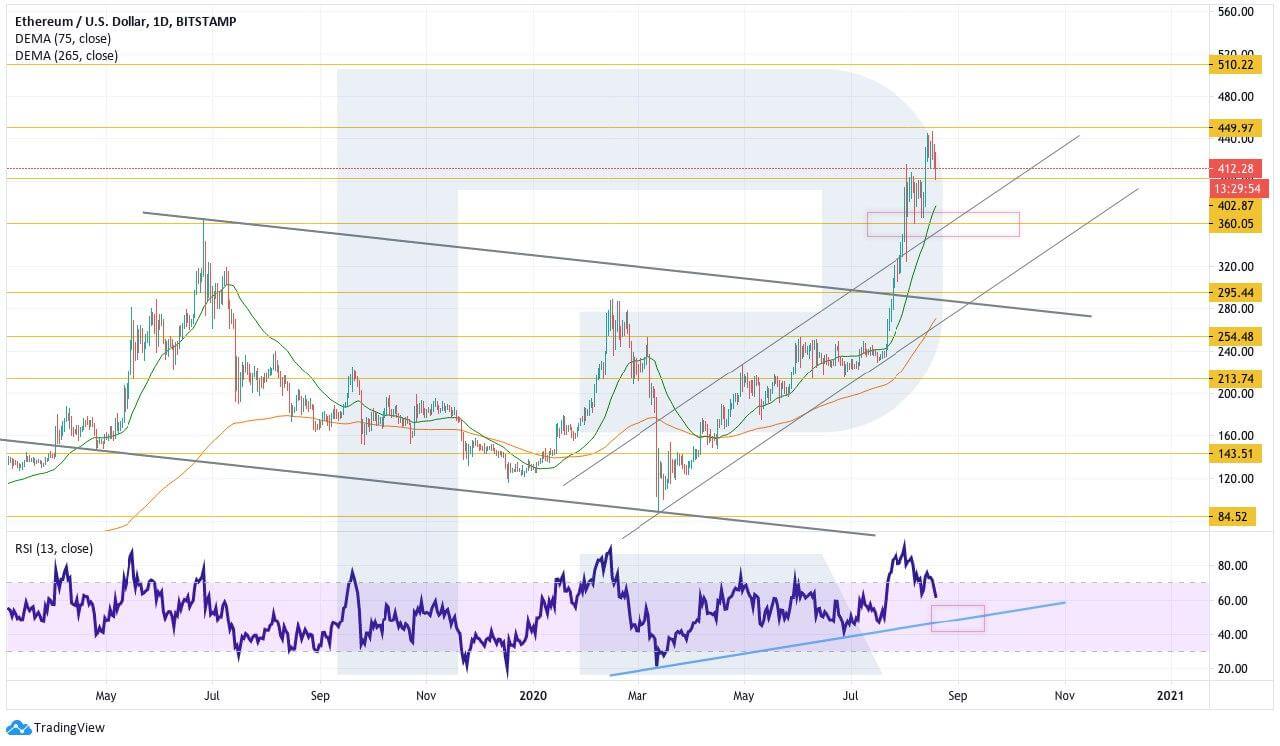
Photo: RoboForex / TradingView
On shorter timeframes, the price is correcting inside the channel. The RSI indicator has almost reached the support line, which is a strong signal in favor of a further growth provided the indicator rebounds from the line. To confirm this idea, the asset must break the resistance area and fix above $450. In this case, the next upside target will be at $510. The key support area here is also $360: after breaking it, the instrument may start a serious descending correction.
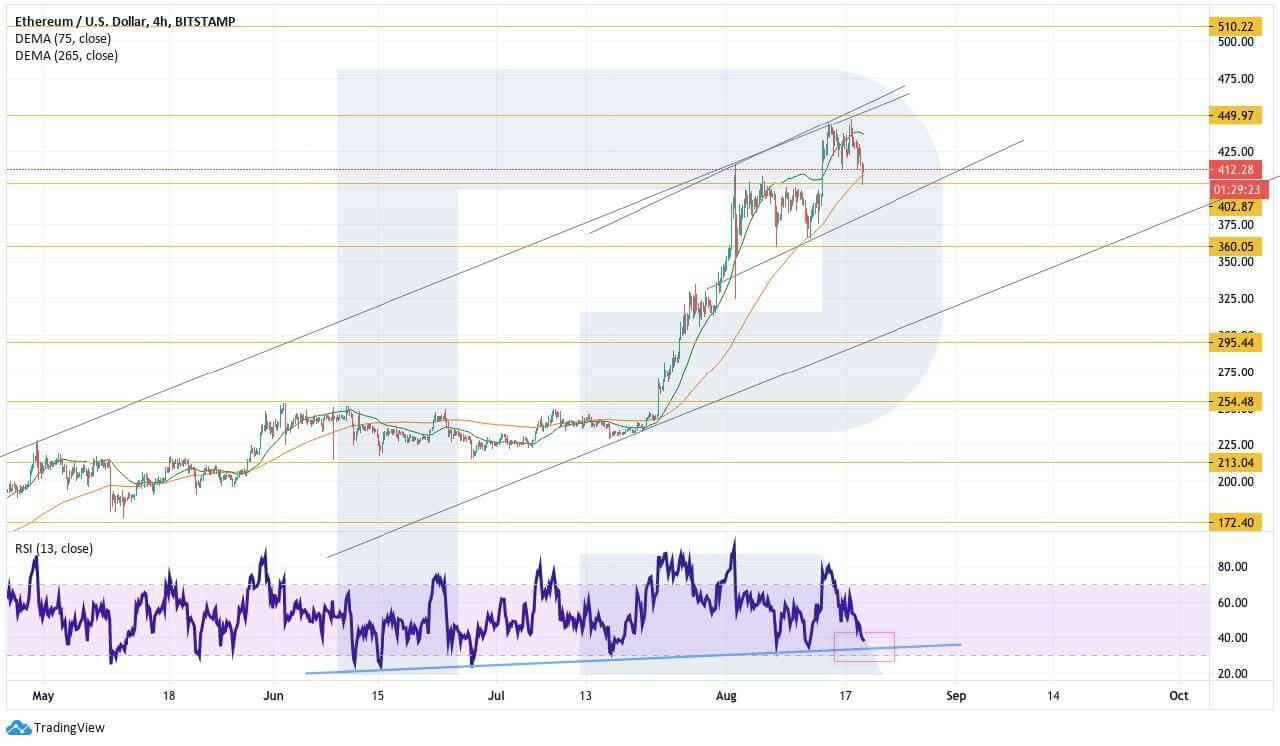
Photo: RoboForex / TradingView
Litecoin
In the daily chart, Litecoin has failed to fix above the rising channel’s upside border but bullish pressure isn’t going down. A little bit lower, there is a support line at the RSI, a rebound from which will indicate another attempt to break the channel and continue forming the ascending impulse. However, a breakout of the line may complete a Head & Shoulders reversal pattern. In this case, the downside target will be at $50.
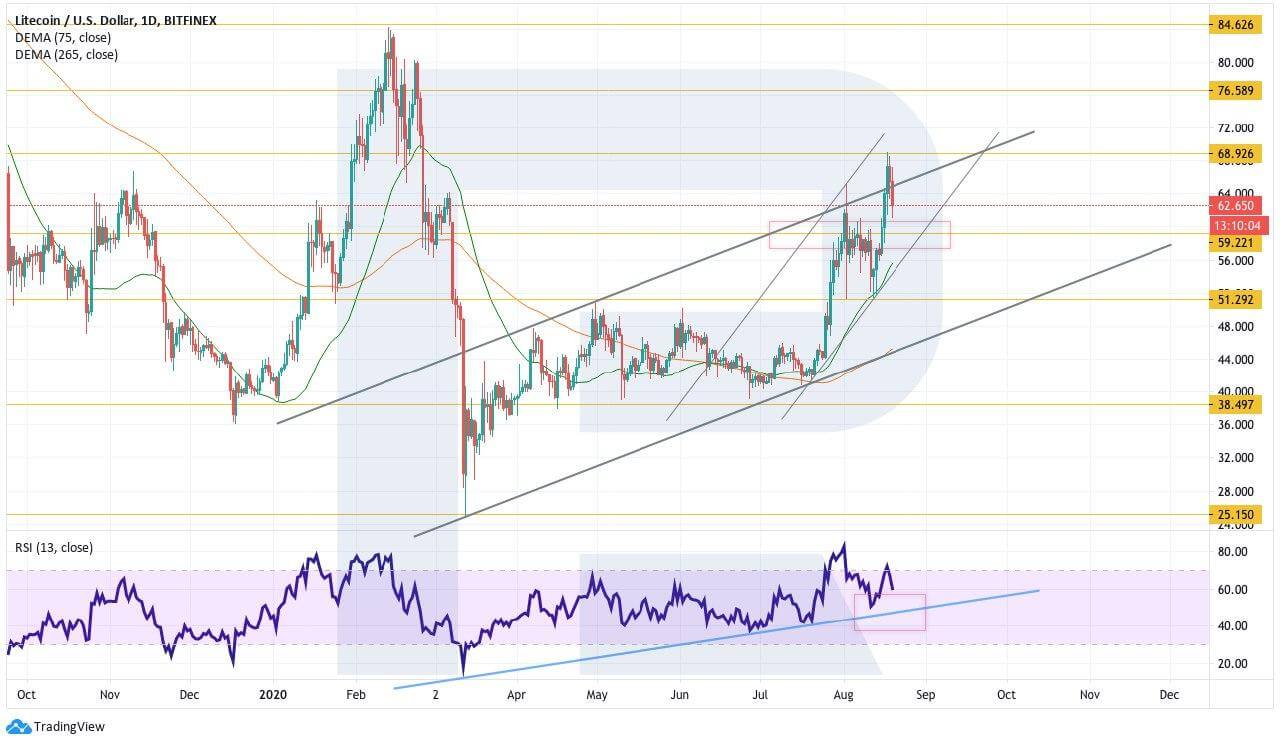
Photo: RoboForex / TradingView
As we can see in the H4 chart, the asset is correcting within the rising channel and forming an ascending “5-0” pattern. While forming the pattern, the pair is expected to test the rising channel’s downside border at $57 and then resume growing with the target at $68.90. Another signal in favor of this idea will be a rebound from the trendline at the RSI. However, this scenario may be canceled if the price falls lower than $55. In this case, the instrument may continue trading downwards to reach $46.
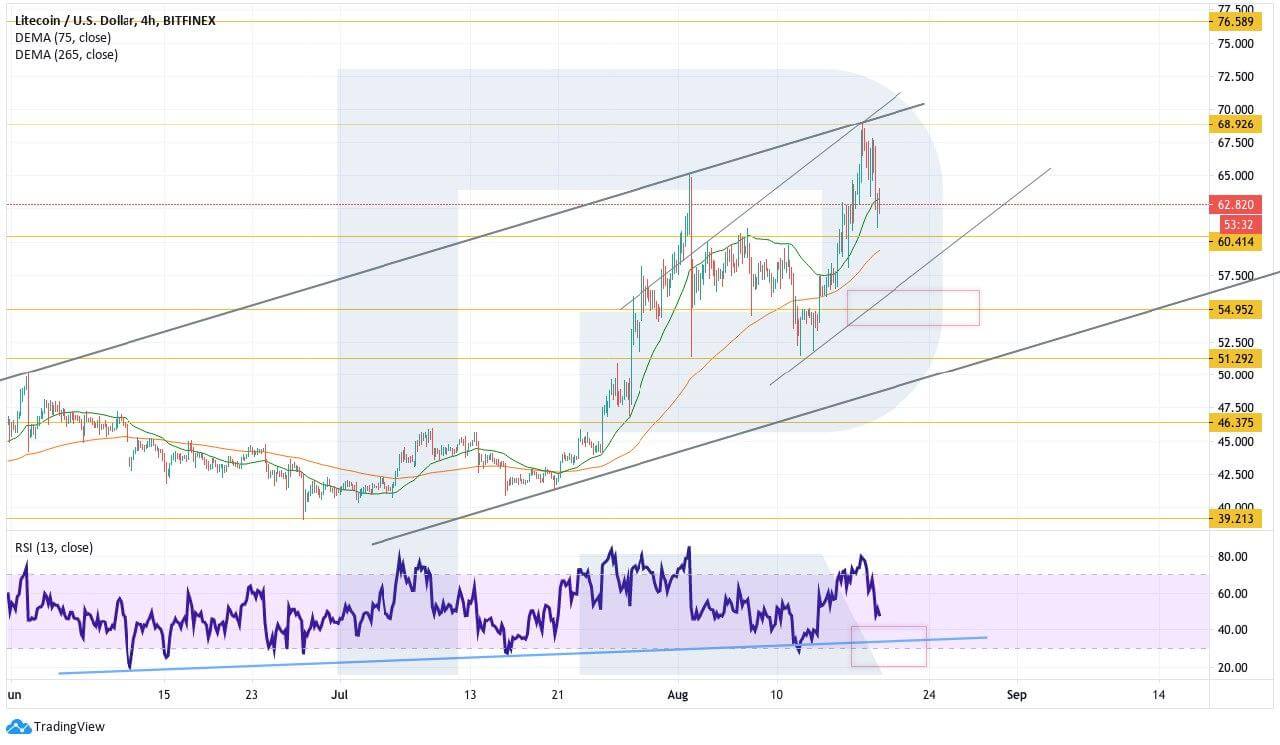
Photo: RoboForex / TradingView
EOS
As we can see in the daily chart, EOS has rebounded from the rising channel’s upside border. However, the price continues rebounding from Tenkan-Sen and Kijun-Sen, thus indicating an ascending impulse. If the asset fixes above $4.06, it may continue growing and cover the distance equal to the width of the current channel. Another signal in favor of this idea will be a rebound from the trendline at the RSI. However, if the indicator breaks the trendline, there might be a new descending correction with the target at $2.40 on the price chart.
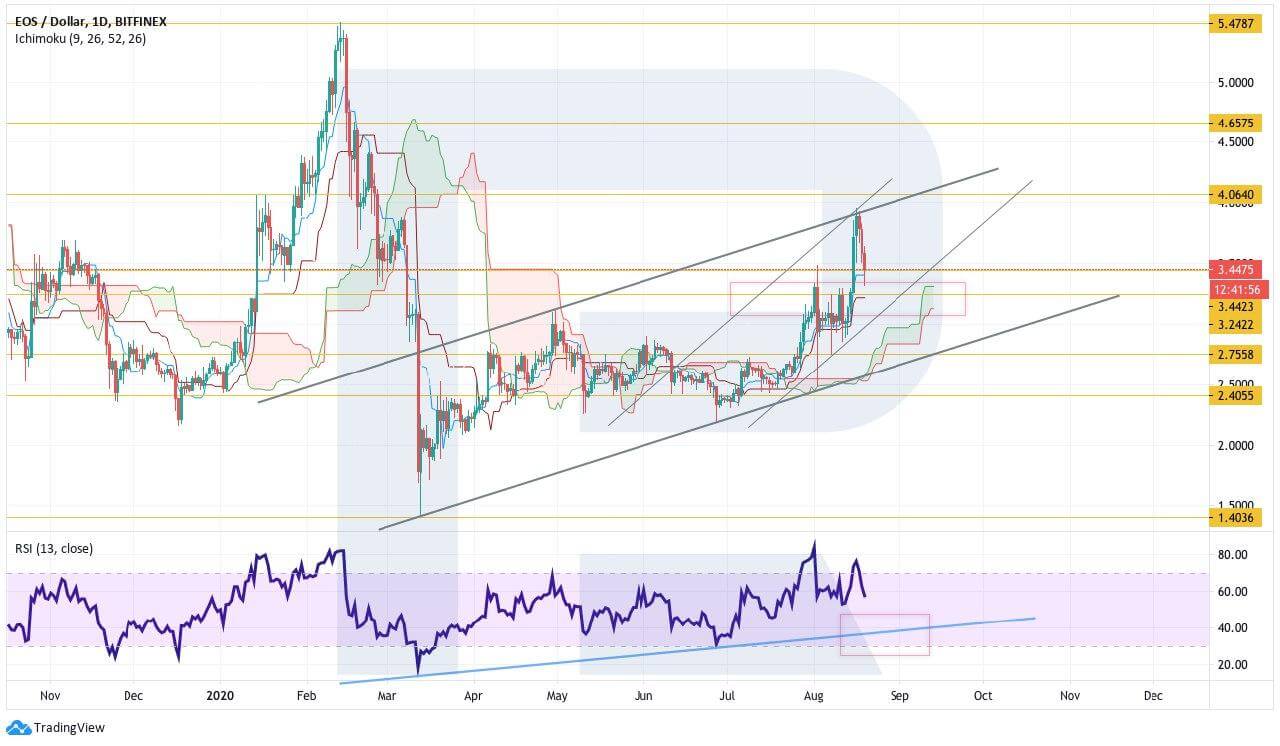
Photo: RoboForex / TradingView
In the H4 chart, the asset is moving very close to the upside border of the Ichimoku Kinko Hyo cloud. One should expect a rebound from the current levels and further growth with the closest target at $3.95. Another signal in favor of this idea will be a rebound from the support line at the RSI: as we can see, the indicator has almost tested the line. However, this scenario may no longer be valid if the cryptocurrency breaks the rising channel’s downside border and fixes below $3.25. After that, the instrument may continue trading downwards to reach $2.78.
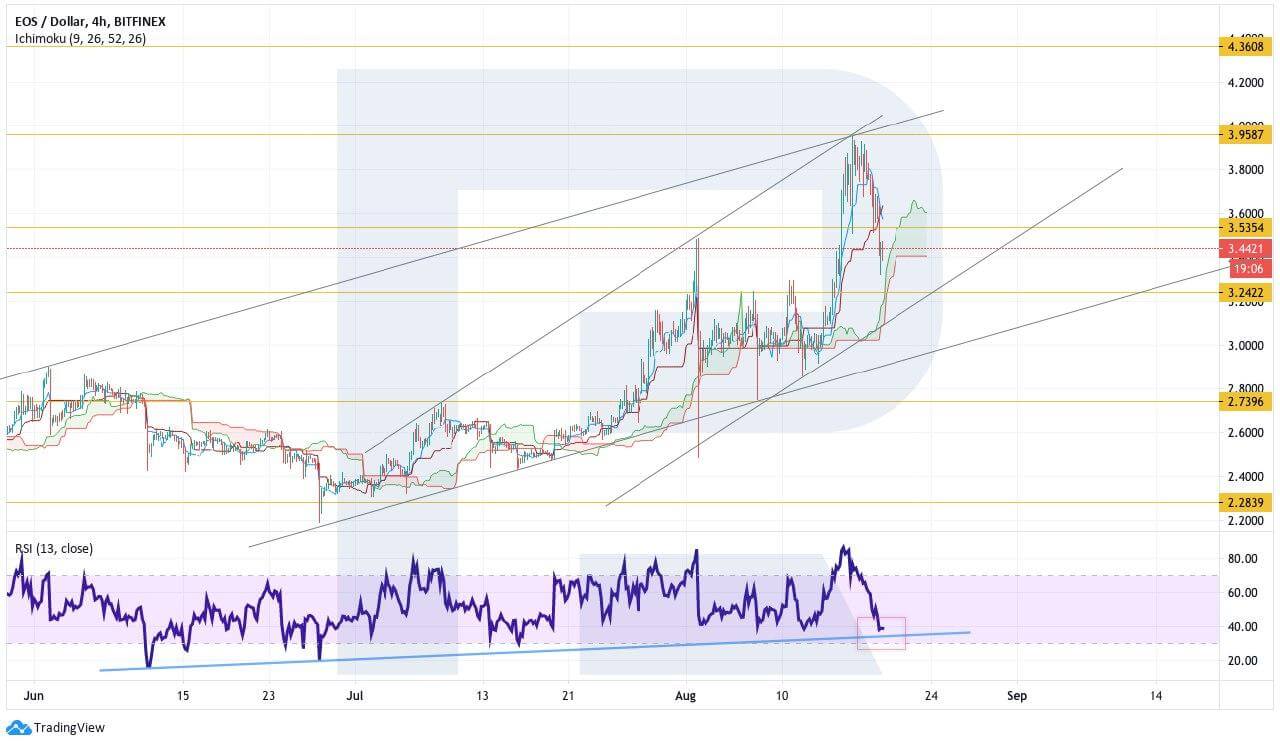
Photo: RoboForex / TradingView
Chainlink
In the daily chart, Chainlink is moving within an aggressive bullish trend. Bulls have already broken one channel to the upside and still continue pressuring. The RSI indicator may test the support line in the nearest future and rebound from it, thus indicating another rebound to the upside and a further growth towards $25.00. However, this scenario may no longer be valid if the asset breaks the rising channel’s downside border and fixes below $14.00. in this case, the instrument may continue the correction to reach $9.10.
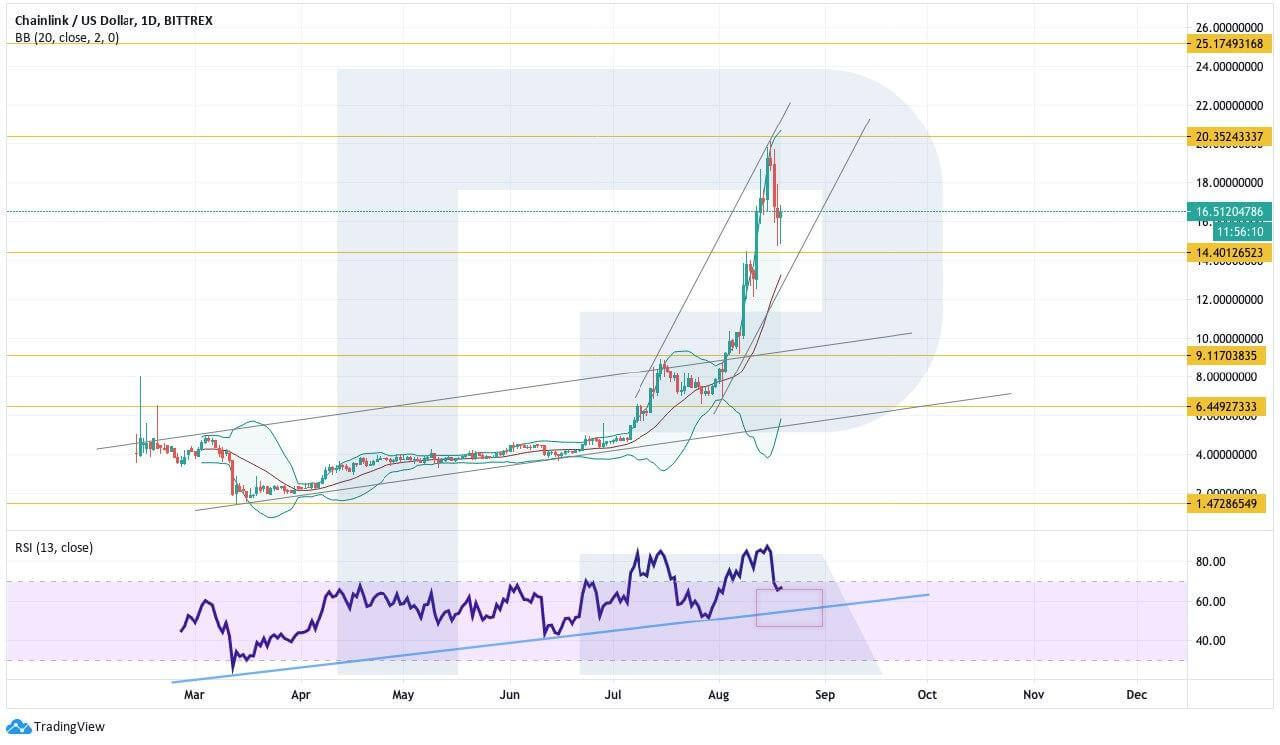
Photo: RoboForex / TradingView
On shorter timeframes, the cryptocurrency is falling within the channel but here is a potential for the formation of a Double Bottom reversal pattern. That’s why, after breaking the resistance area and fixing above $17.10, the asset may continue trading upwards to reach $18.40. A strong signal in favor of this idea is a breakout of the descending trendline at the RSI. Still, this bullish scenario may be canceled if the price breaks the support area and fixes below $14.55. After that, the instrument may continue falling with the target at $12.00.
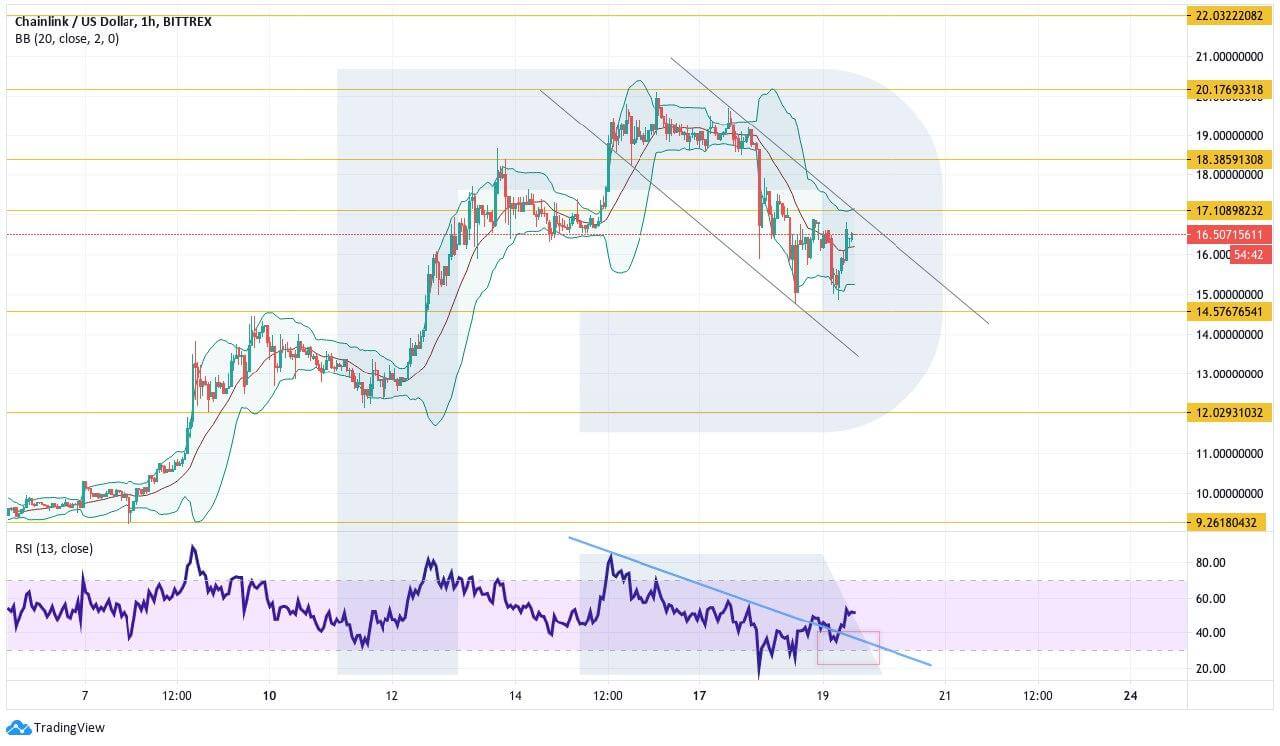
Photo: RoboForex / TradingView