Crypto Price Analysis August 26: BTC, ETH, LTC, BCH, EOS
Coinspeaker
Crypto Price Analysis August 26: BTC, ETH, LTC, BCH, EOS
Dmitriy Gurkovskiy, a senior analyst at foreign exchange broker RoboForex, provides his vision of the possible tendencies in price changes for Bitcoin as well as for other major cryptos.
On one hand, the Bitcoin chart is already showing some ideas in favor of further descending movement but it’s too early to talk about a proper decline as long as the instrument is trading above the support area at $10,500. Moreover, such cryptocurrencies as Litecoin provide steady signals in favor of further uptrend, that’s why one shouldn’t exclude the possibility that the primary correctional signal in the leading cryptoasset may be canceled and the market will once again try to resume the bullish impulse. Bulls have to continue their pressure and push the price as high as possible starting from the current levels.
Bitcoin
In the daily chart, Bitcoin continues falling; the key support levels are at $11,240 and $11,535. The RSI has broken the support line, thus indicating a potential decline of the cryptocurrency towards $11,240. After breaking this area and fixing below the rising channel’s downside border, BTC/USD may continue trading downwards to reach $8,830. However, the main scenario implies that the price may rebound from the above-mentioned border and resume growing towards new highs.
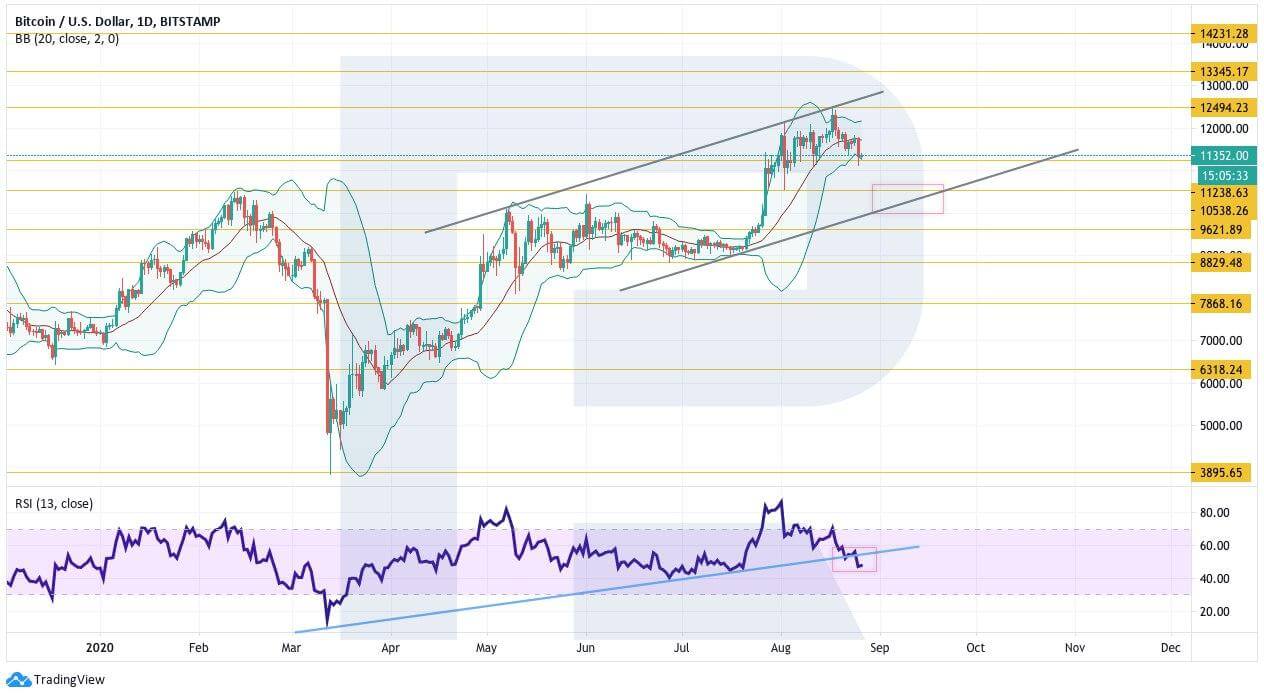
Photo: RoboForex / TradingView
As we can see in the H4 chart, the cryptoasset has also broken the rising channel’s downside border. If the price breaks the support area and fixes below $11,110, the pair may continue falling with the target at $10,540 or even lower at the distance equal to the width of the broken channel. Still, the asset may resume trading upwards but only after breaking $11,970. In еры case, the instrument may get back inside the channel and break the closest resistance level.
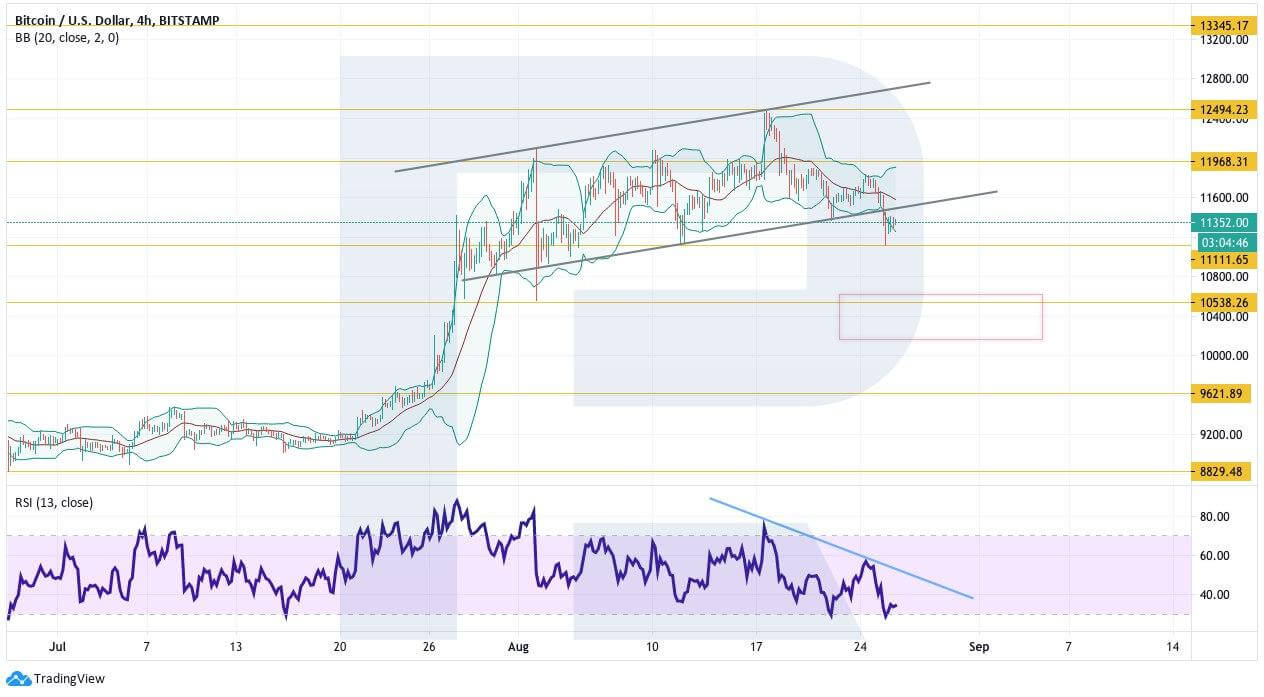
Photo: RoboForex / TradingView
Ethereum
As we can see in the daily chart, ETH/USD couldn’t break $450 but wasn’t able to break the support area either. Instead, it just tested the downside border of the Bollinger Bands indicator, thus showing a bullish pressure on the market. In addition to that, the RSI has broken the support line. However, if the indicator breaks the line upwards in the nearest future, the asset may continue rising. A strong signal in favor of this idea will be a rebound from the rising channel’s upside border. Still, if the price breaks the support area and fixes below $360, the instrument may continue trading downwards with the target at $295.
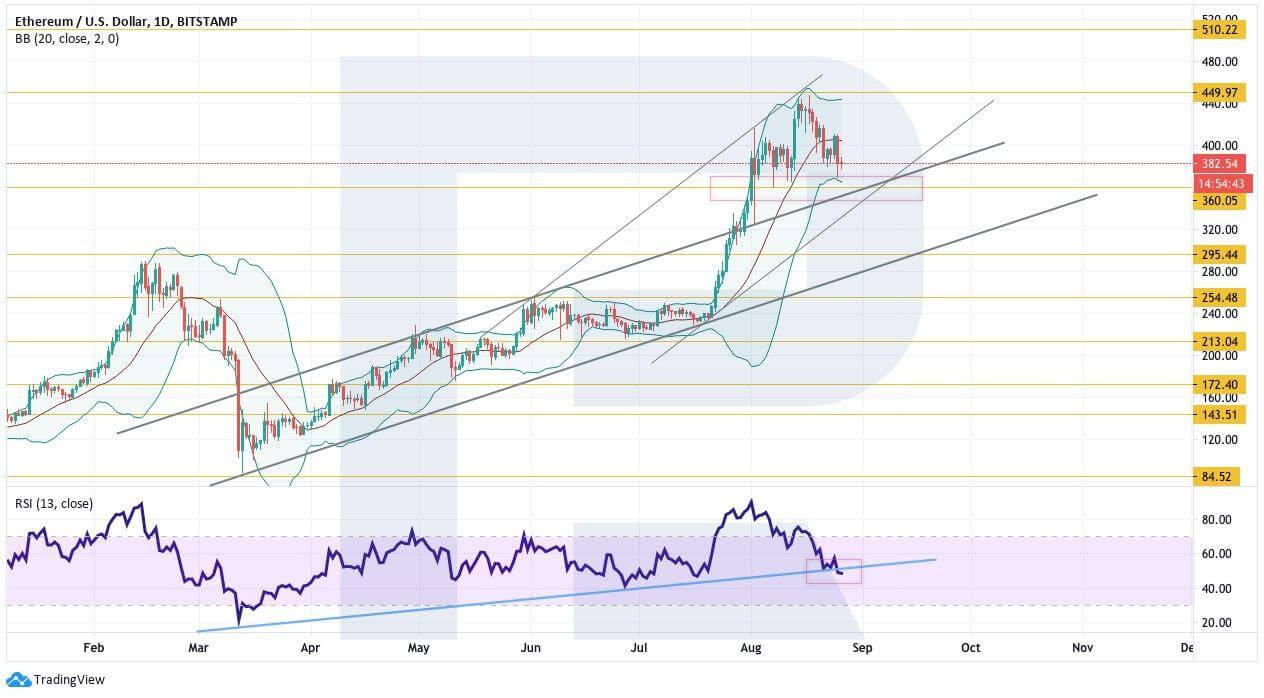
Photo: RoboForex / TradingView
On shorter timeframes, the cryptocurrency is correcting while forming a Head & Shoulders reversal pattern. To finish the pattern, the price must test $415, where it is expected to complete the right Shoulder and start falling. To confirm the pattern, the pair must break $365, thus indicating a decline below the Neckline towards $305. A signal in favor of this idea will be a rebound from the resistance line at the RSI. However, this scenario may no longer be valid if the instrument breaks $450 to the upside. In this case, the above-mentioned pattern will be canceled and the asset will continue trading upwards to reach $500 or even higher.
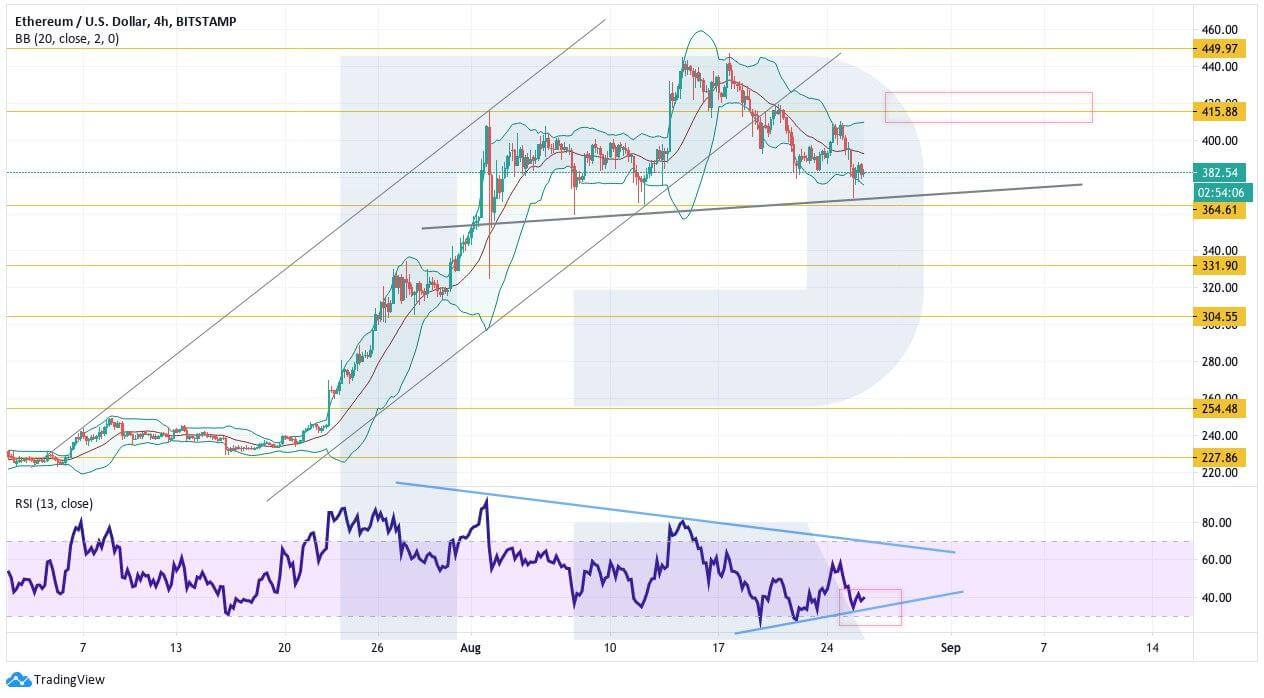
Photo: RoboForex / TradingView
Litecoin
In the daily chart, Litecoin still hasn’t been able to fix above the rising channel’s upside border to confirm a strong ascending movement. At the same time, the RSI is testing the support line and that is a signal in favor of a rebound to the upside towards $68. It should be noted that the above-mentioned line has already been broken in other assets, that’s why it’s very important for bulls to fix above $60. However, if the instrument breaks this level, the asset may continue falling towards the channel’s downside border at $51.
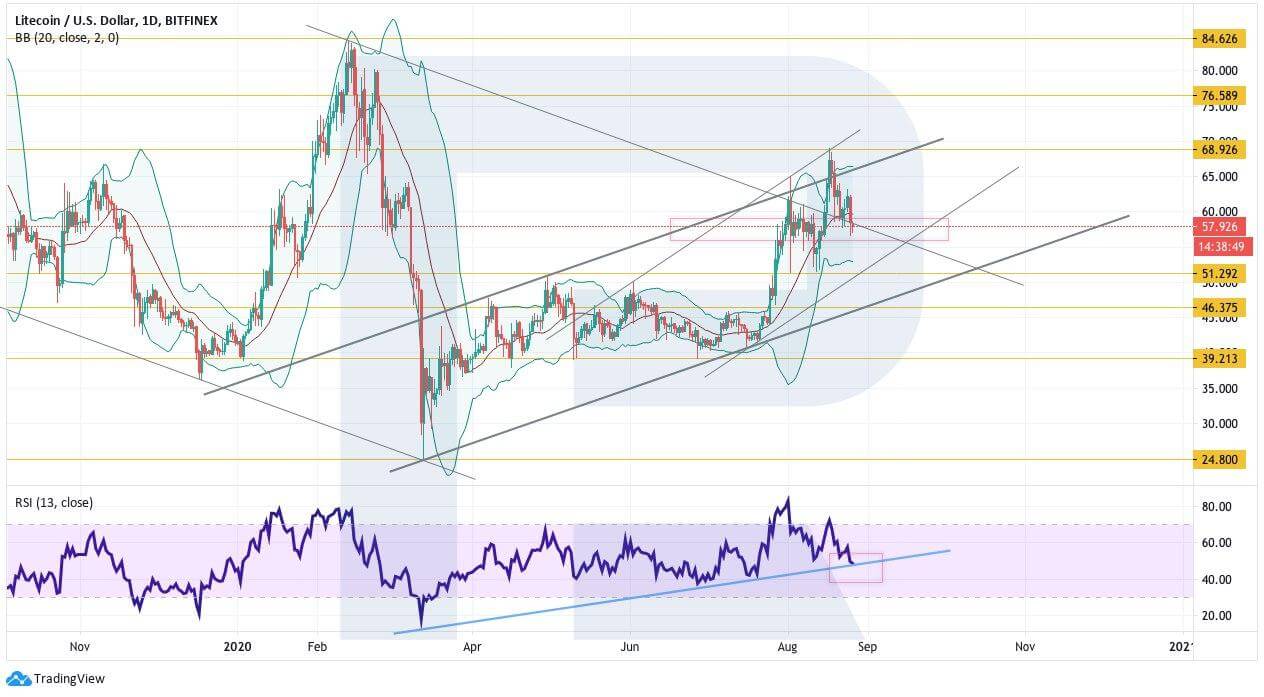
Photo: RoboForex / TradingView
As we can see in the H4 chart, LTC/USD is testing the rising channel’s downside border. There is a potential for a rebound to the upside and a new ascending movement towards $64, a breakout of which may indicate further growth to reach $68. A strong signal in favor of this idea will be a rebound from the trendline at the RSI. However., this scenario may no longer be valid if the asset breaks the channel’s downside border and fixes below $55. After that, the instrument may continue falling to reach $51, a breakout of which will lead to a further decline towards $46.
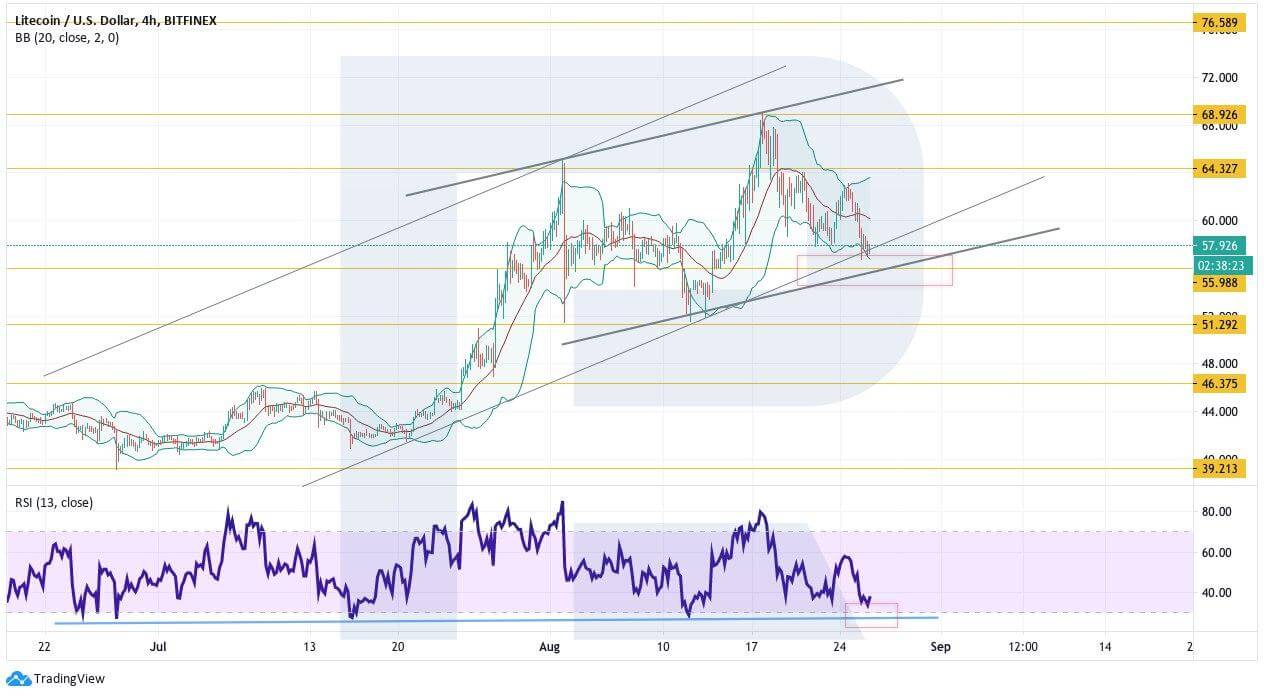
Photo: RoboForex / TradingView
Bitcoin Cash
As we can see in the daily chart, Bitcoin Cash is still testing the sideways channel’s upside border. The RSI has almost tested the support line. Both these factors taken together indicate a potential rebound to the upside and further growth. To confirm this idea, the asset must break the resistance area and fix above $340. However, this scenario may no longer be valid if the asset breaks the rising channel’s downside border and fixes below $255. After that, the instrument may continue trading downwards to reach $140.
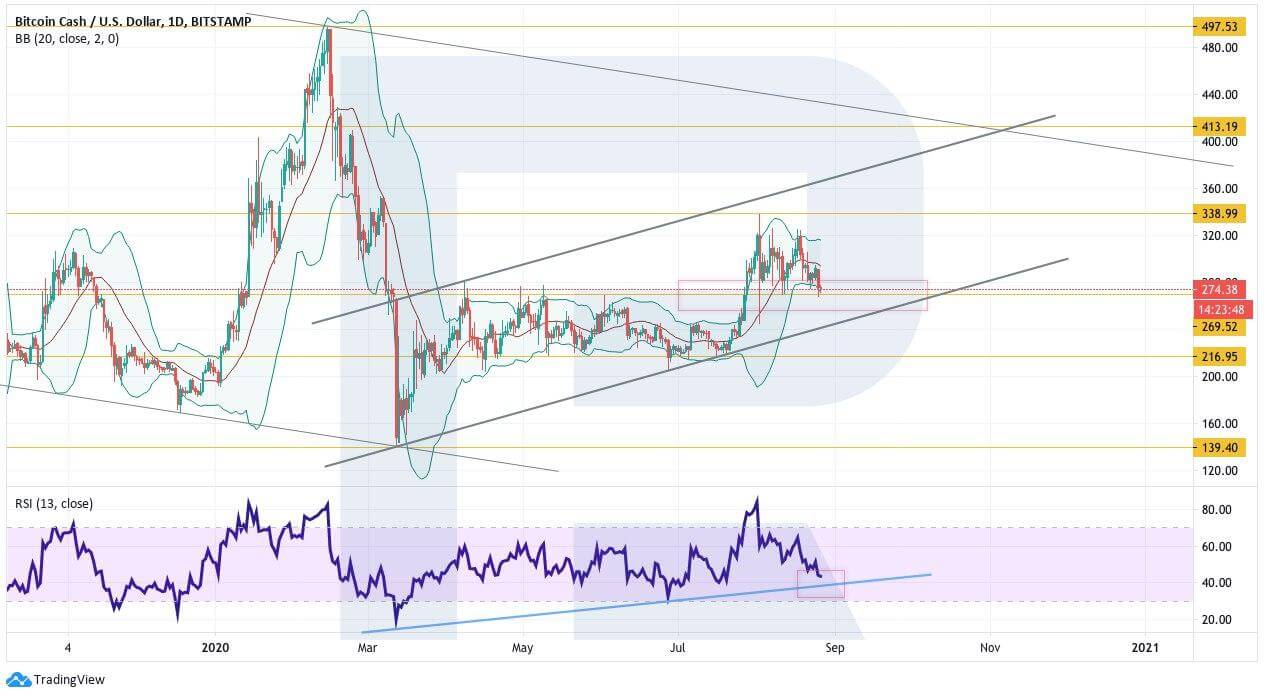
Photo: RoboForex / TradingView
In the H4 chart, the cryptocurrency is rebounding from the downside border of a Triangle pattern. The RSI is testing the trendline, which may lead to a rebound to the upside towards $325. To confirm this idea, the asset must break the descending channel’s upside border and fix above $295. However, this scenario may be canceled if the pair falls and beaks $270. In this case, the instrument may fix below the pattern’s downside border and continue trading downwards to reach $216.
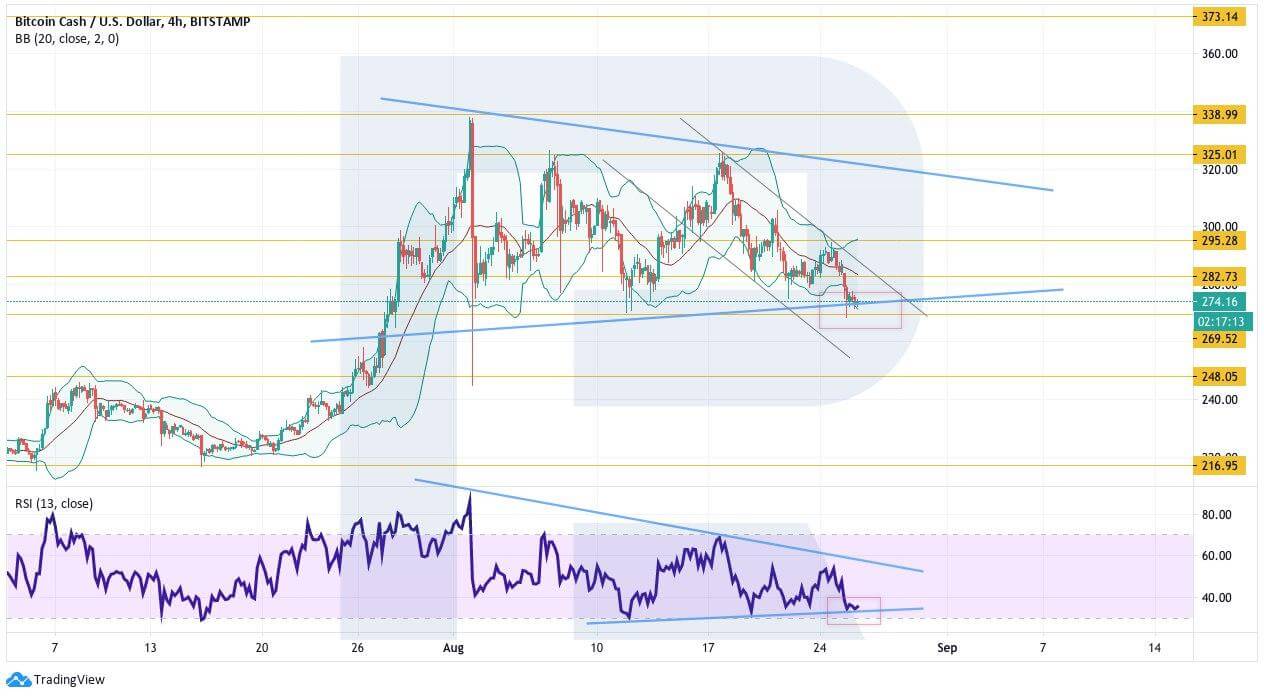
Photo: RoboForex / TradingView
EOS
In the daily chart, EOS continues correcting; right now, it is rebounding from the support area. The RSI hasn’t reached the trendline yet, that’s why the asset may yet move downwards. Possibly, the cryptocurrency may test $2.90 and then resume growing towards $4.15. To confirm this idea, the pair must break $3.55 and leave the descending channel. However, if the price breaks the rising channel’s downside border and fixes below $2.55, the asset may continue falling to reach $2.23. If this level is also broken, the decline may continue towards $1.28.
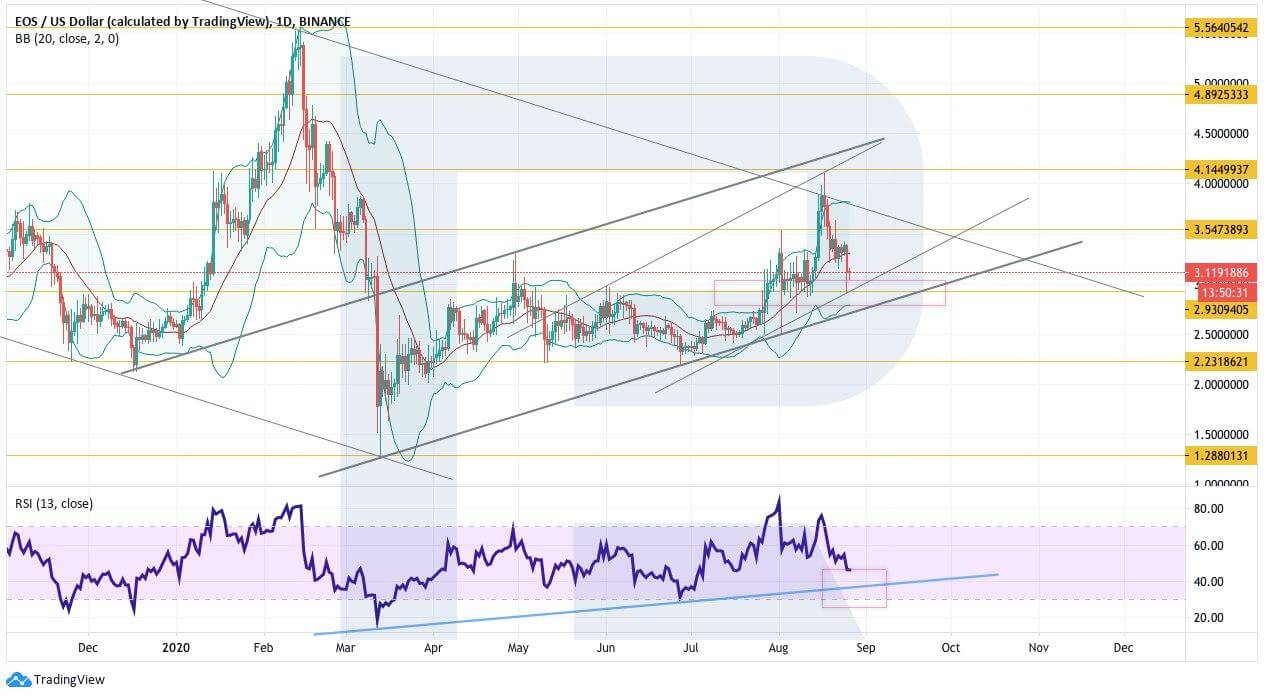
Photo: RoboForex / TradingView
As we can see in the H4 chart, EOS has rebounded from the rising channel’s downside border. The RSI is also trying to rebound from the support line, thus indicating a potential growth towards $4.14. To confirm this idea, the asset must break the descending channel’s upside border and fix above $3.35. Still, this scenario may no longer be valid if the price breaks the support area and fixes below $2.96. After that, the instrument may continue trading downwards to reach $2.39.
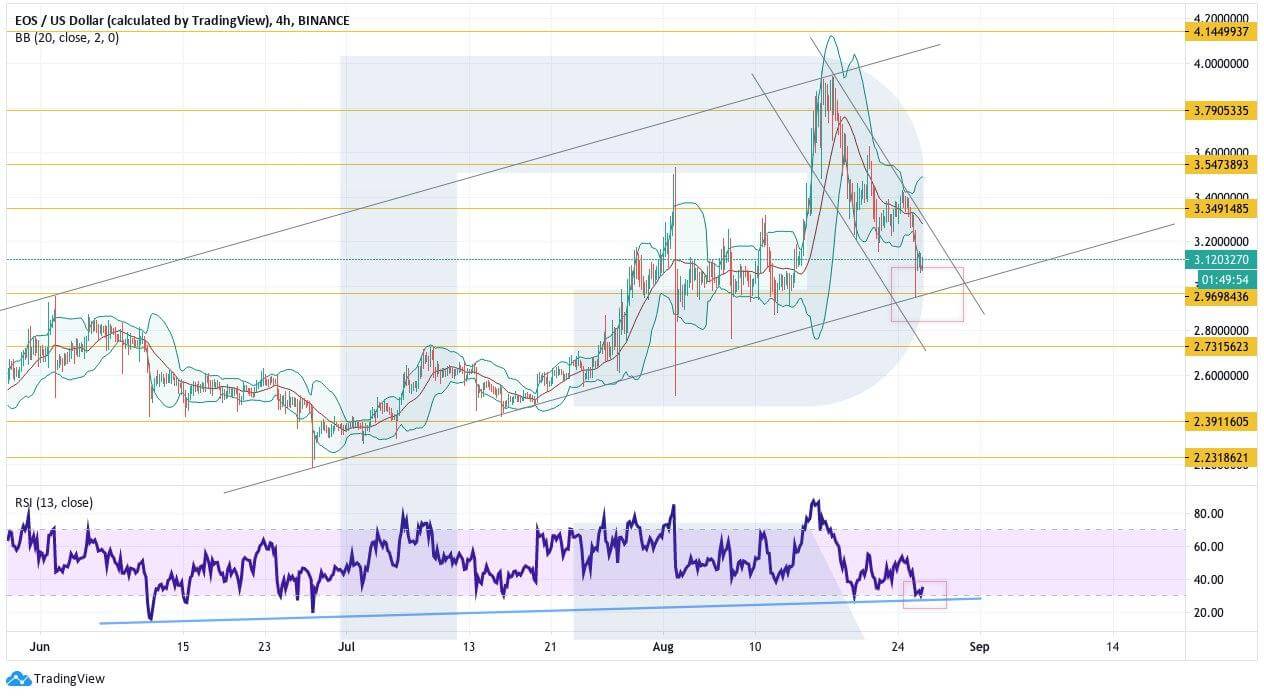
Photo: RoboForex / TradingView