Bitcoin Could Run to New Highs as BTC Forms Tweezer Bottom at $19,000
- Bitcoin has undergone its latest leg higher just recently, pushing to $19,450 on top exchanges.
- The coin now trades for $19,150 after a slight retracement.
- Analysts remain bullish as the chart remains bullish: a trader said that the coin just formed a tweezer bottom when it went to test the lows at $18,900.
- Bitcoin bouncing off that Fibonacci level may suggest that the trend is still in favor of bulls.
Bitcoin Could Move Back Toward the Highs
Bitcoin has undergone its latest leg higher just recently, pushing to $19,450 on top exchanges. The coin has retraced to $19,150 as of this article’s writing, facing a slight drawdown amid some weakness in altcoins and as the buying pressure that was seen the other day abates.
The coin dropped as low as $18,900 a number of hours ago, facing some selling pressure as Ethereum tumbled lower.
Despite this, analysts are still bullish.
Bitcoin just formed a tweezer bottom when it went to test the lows at $18,900. Referencing the chart seen below, a leading crypto trader said, pointing to the tweezer bottom and how Bitcoin held the pivotal Fibonacci level:
“that’s a nice tweezer off the one hour and bounce off the 38.2.”
Bitcoin bouncing off that Fibonacci level may suggest that the trend is still in favor of bulls. The chart also seems to suggest that Bitcoin could soon rocket back towards the local highs at $19,450.
It is still unclear, though, whether or not the cryptocurrency will set new all-time highs before Thanksgiving as some were hoping for. Ethereum-focused prediction market PolyMarket has a market for this outcome, which is currently leaning 88% to “no.”
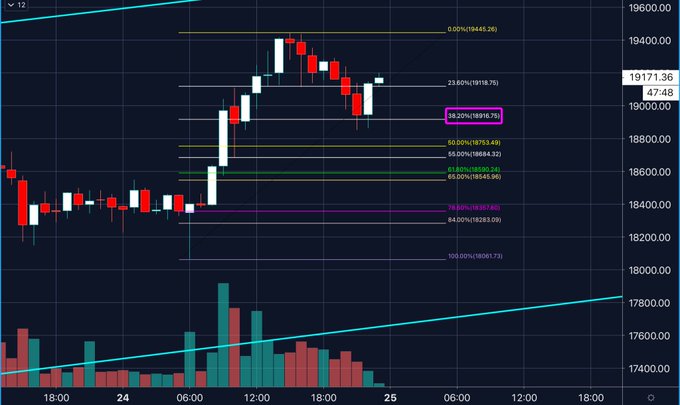
Chart of BTC's price action over the past day with analysis by crypto trader Big Chonis (BigChonis on Twitter).
Source: BTCUSD from TradingView.com
Other Positive Signs
There are other positive signs that indicate Bitcoin’s trend is still one of growth.
An analyst that is known as TradingShot recently shared the chart seen below, which is showing Bitcoin has somewhat of a fractal with the price of gold.

Bitcoin-Gold correlation since September 2018. Source: BTCUSD on TradingView
This fractal predicts that should the cryptocurrency follow the path of gold, it will soon erupt higher past its all-time high toward $25,000, then may face a strong retracement.
Analysts give credence to this theory because they see Bitcoin as gold 2.0.
This long-term correlation could also give rise to long-term growth in the BTC price as analysts expect gold’s price to increase as inflation does.
Featured Image from Shutterstock
Price tags: xbtusd, btcusd, btcusdt
Charts from TradingView.com
Bitcoin Could Run to New Highs as BTC Forms Tweezer Bottom at $19,000