Monthly Cryptocurrency Market Analysis [April 2018]
Information as of May 1, 2018
This report was created by:
- Professor Dmitrii Kornilov, Doctor of Economics, Member of the Russian Academy of Natural Sciences, and Leading Analyst at ICOBox;
- Dima Zaitsev, PhD in Economics, Head of International Public Relations and Business Analytics Department Chief at ICOBox;
- Nick Evdokimov, Co-Founder of ICOBox;
- Mike Raitsyn, Co-Founder of ICOBox;
- Anar Babaev, Co-Founder of ICOBox;
- Daria Generalova, Co-Founder of ICOBox
This report presents data on the cryptocurrency market changes during 2017-2018. Special emphasis has been placed on an analysis of the changes that have taken place in April 2018, including over the period from April 23-30, 2018.
1. General cryptocurrency and digital assets market analysis (by week, month, quarter). Market trends.
1.1 General cryptocurrency and digital assets market analysis (by week, month).
Table 1.1. Trends in capitalization of the cryptocurrency market and main cryptocurrencies from January 1, 2018, to April 30, 2018*
| Parameter | 1-Jan-18 | 1-Feb-18 | MoM, % | 1-Mar-18 | MoM, % | 1-Apr-18 | MoM, % | 30-Apr-18 | DoD, % | |
| 1 | Total market capitalization, USD billion | 612.9 | 517.2 | -15.6% | 440.0 | -14.9% | 263.9 | -40.0% | 438.9 | 66.3% |
| 2 | Altcoin market capitalization, USD billion | 376.2 | 344.8 | -8.3% | 264.6 | -23.3% | 145.2 | -45.1% | 278.6 | 91.9% |
| Altcoin dominance, % | 61.4% | 66.7% | – | 60.1% | – | 55.0% | – | 63.5% | – | |
| 3 | Bitcoin price, $ | 14 112.2 | 10 237.3 | -27.5% | 10 385.0 | 1.4% | 7 003.1 | -32.6% | 9 426.1 | 34.6% |
| Bitcoin market capitalization, USD billion | 236.7 | 172.4 | -27.2% | 175.4 | 1.8% | 118.7 | -32.3% | 160.3 | 35.0% | |
| Bitcoin dominance, % | 38.6% | 33.3% | – | 39.9% | – | 45.0% | – | 36.5% | – | |
| 4 | Ethereum price, $ | 755.8 | 1 119.4 | 48.1% | 856.0 | -23.5% | 397.3 | -53.6% | 689.8 | 73.6% |
| Ethereum market capitalization, USD billion | 73.1 | 109.0 | 49.1% | 83.8 | -23.1% | 39.1 | -53.3% | 68.4 | 74.7% | |
| Ethereum dominance, % | 11.9% | 21.1% | – | 19.0% | – | 14.8% | – | 15.6% | – | |
| 5 | Bitcoin Cash price, $ | 2 534.8 | 1 491.1 | -41.2% | 1 204.8 | -19.2% | 688.0 | -42.9% | 1 441.0 | 109.4% |
| Bitcoin Cash market capitalization, USD billion | 42.8 | 25.3 | -41.0% | 20.5 | -19.0% | 11.7 | -42.7% | 24.6 | 110.1% | |
| Bitcoin Cash dominance, % | 7.0% | 4.9% | – | 4.7% | – | 4.4% | – | 5.6% | – | |
| 6 | Litecoin price, $ | 231.7 | 163.7 | -29.3% | 203.1 | 24.1% | 116.9 | -42.4% | 153.7 | 31.4% |
| Litecoin market capitalization, USD billion | 12.6 | 9.0 | -28.8% | 11.3 | 25.0% | 6.5 | -42.0% | 8.7 | 32.4% | |
| Litecoin dominance, % | 2.1% | 1.7% | – | 2.6% | – | 2.5% | – | 2.0% | – | |
| 7 | Volume (24h) 4 crypto, USD billion | 15.7 | 17.3 | 10.2% | 10.1 | -41.4% | 6.4 | -36.9% | 12.9 | 100.7% |
| Market cap 4 crypto, USD billion | 441.6 | 351.6 | -20.4% | 315.1 | -10.4% | 189.7 | -39.8% | 287.4 | 51.5% | |
| ZAK-4 Crypto index | 3.6% | 4.9% | – | 3.2% | – | 3.4% | – | 4.5% | – | |
| 4 crypto dominance, % | 72.0% | 68.0% | – | 71.6% | – | 71.9% | – | 65.5% | – | |
| 8 | Volume (24h) 8 crypto, USD billion | 17.2 | 19.0 | 10.2% | 11.3 | -40.3% | 7.2 | -36.3% | 17.7 | 144.3% |
| Market cap 8 crypto, USD billion | 488.6 | 393.4 | -19.5% | 349.3 | -11.2% | 208.7 | -40.2% | 331.9 | 59.0% | |
| ZAK-8 Crypto index | 3.5% | 4.8% | – | 3.2% | – | 3.5% | – | 5.3% | – | |
| 8 crypto dominance, % | 79.7% | 76.1% | – | 79.4% | – | 79.1% | – | 75.6% | – |
* Data as of April 30, 2018 (all figures calculated at 03:00 UTC)
** Since December 1, 2017, the ZAK-4 index has been calculated using the cryptocurrencies Bitcoin, Ethereum, Ripple, and Bitcoin Cash.
*** When calculating the ZAK-8 index, the cryptocurrencies with the largest capitalization are used. At present (April 30, 2018), the cryptocurrencies Bitcoin, Ethereum, Ripple, Bitcoin Cash, Cardano, Litecoin, Stellar, and EOS.
Data source: coinmarketcap.com
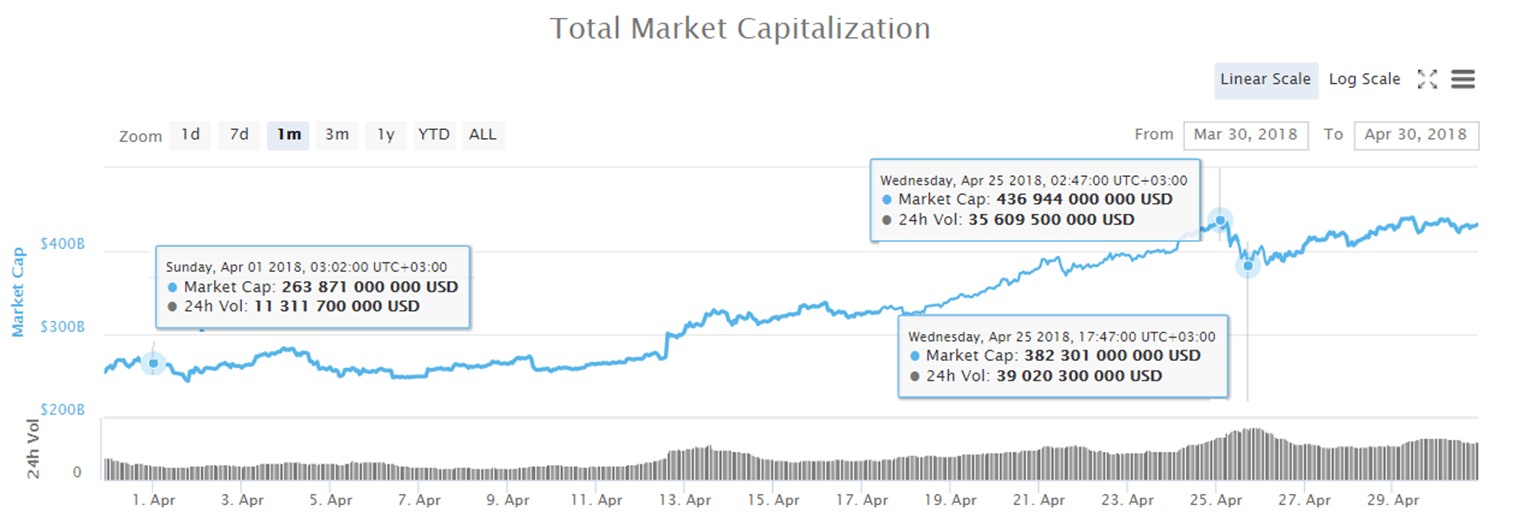
During April 2018 cryptocurrency market capitalization increased from $263.9 billion to $438.9 billion, or by 66.3% (see Table 1.1, Fig. 1), bringing capitalization back to the level at the beginning of March.
The dominance of the four and eight largest cryptocurrencies as of 03:00 UTC on April 30, 2018, equaled 65.5% and 75.6%, respectively. Bitcoin dominance decreased over the month from 45% to 36.5% (see Table 1.1), i.e. one can conclude that altcoin prices increased more during April than the price of the cryptocurrency market leader.
The market grew by $175 billion in April, with altcoins accounting for most of the growth (altcoin capitalization increased by $133 billion, while the growth in bitcoin capitalization equaled $42 billion).
The most significant changes in cryptocurrency market capitalization during the month are shown in Fig. 1.
Figure 1. Cryptocurrency market capitalization since April 1, 2018
Data source: coinmarketcap.com
Price trends of the cryptocurrency market leaders during April 2018
Table 1.2 presents the price trends of 10 cryptocurrencies in April 2018. The price fluctuations among the top 10 cryptocurrencies by capitalization over the past month equaled more than 49% (High/Low). EOS and TRON experienced the most sizeable fluctuations, with their highest (High) and lowest (Low) prices during April ranging from $5.25 to $22.89 and from $0.029 to $0.101, respectively, a difference or more than 250%. Serious fluctuations were also seen in the prices of Bitcoin Cash and Cardano (see Table 1.2).
Table 1.2. Price changes in the top 10 cryptocurrencies by capitalization during the period from April 1-30, 2018
| № | Name | Price Open, $ | Change | Price change during April | High / Low | |||
| 01.04.2018 | 30.04.2018 | % | High, $ | Low, $ | D, $ | |||
| 1 | Bitcoin | 7003.1 | 9426.1 | +34.6% | 9745.32 | 6526.87 | 3 218.45 | 1.49 |
| 2 | Ethereum | 397.3 | 689.8 | +73.6% | 708.88 | 363.81 | 345.07 | 1.95 |
| 3 | Ripple | 0.51 | 0.87 | +69.6% | 0.97 | 0.47 | 0.50 | 2.07 |
| 4 | Bitcoin Cash | 688.0 | 1441.0 | +109.4% | 1560.94 | 603.71 | 957.23 | 2.59 |
| 5 | EOS | 6.00 | 21.64 | +260.7% | 22.89 | 5.25 | 17.64 | 4.36 |
| 6 | Cardano | 0.16 | 0.36 | +132.6% | 0.39 | 0.14 | 0.25 | 2.74 |
| 7 | Litecoin | 116.9 | 153.7 | +31.4% | 165.94 | 110.52 | 55.42 | 1.50 |
| 8 | Stellar | 0.21 | 0.46 | +120.8% | 0.46 | 0.19 | 0.27 | 2.44 |
| 9 | TRON | 0.034 | 0.090 | +164.0% | 0.101 | 0.029 | 0.07 | 3.54 |
| 10 | NEO | 50.3 | 92.2 | +83.1% | 94.76 | 44.59 | 50.17 | 2.13 |
| Portfolio 10 crypto | +108.0% | 108.0% | ||||||
Data source: coinmarketcap.com
Therefore, the prices of all the leading cryptocurrencies by capitalization appreciated during the period from April 1-30, 2018, within a range from +31.4% (Litecoin) to +260.7% (EOS) compared to the start of the month (Fig. 2). The average portfolio return (Portfolio 10 crypto) for a portfolio consisting of equal shares of the top 10 cryptocurrencies was positive during April, and equaled 108.0% (i.e. the value of a balanced portfolio more than doubled over the month). The capitalization of the cryptocurrency market as a whole increased by +66.3% during April.
Figure 2. Price change in the top 10 cryptocurrencies by capitalization during April 2018, %
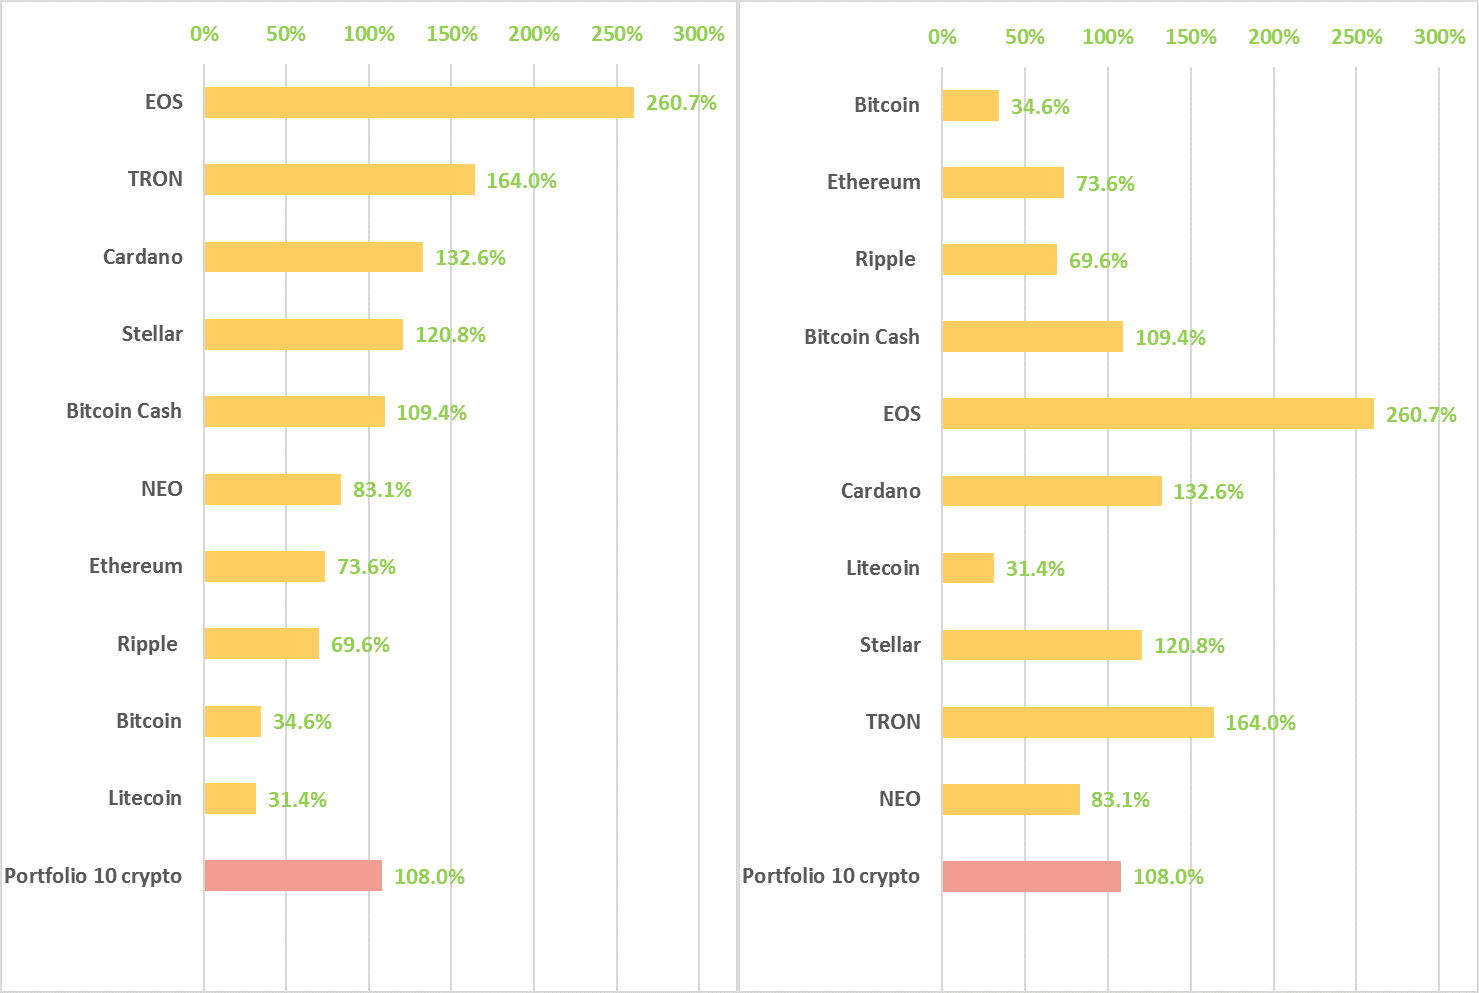
(on the left the cryptocurrencies are arranged by the level of price growth over the month, and on the right – by the amount of capitalization as of May 1, 2018)
After a downward adjustment lasting for several months, April was a turning point during which total cryptocurrency market capitalization increased from $250 billion to $430 billion, reaching the level of the end of February. Most cryptocurrencies showed price growth, with some of them (EOS, Tron, Cardano, Stellar, and Bitcoin Cash, to name a few) appreciating by more than 100%.
The thaw on the cryptocurrency market can be attributed to several factors, including the cyclical nature of the market and positive news items on the world stage. For example, a group of countries (the United Kingdom, France, Germany, Norway, Spain, and the Netherlands, among others) signed a declaration on the creation of a single digital market and partnership in the blockchain industry (Financemagnates.com).
Mufti Muhammed Abu-Bakar, advisor on Sharia Law of the Indonesian crowdfunding platform Blossom Finance, published a document that, in essence, officially allows Muslims to use bitcoin (Independent.co.uk). Also, CBOE announced record trading volumes in bitcoin futures (Investopedia.com/). The number of transactions on the Chicago options exchange exceeded the average daily trading volume (6600) by nearly a factor of three.
The top three cryptocurrencies in terms of price growth in April were EOS, TRON and Cardano.
The story having the biggest impact on the EOS price in April was the news that EOS is preparing to launch its main network on June 2. The unveiling of EOS.io will signal the transition of EOS from the Ethereum blockchain to its own network, which will be bring about a host of positive effects. The transition will facilitate an increase in speed, a lowering of costs, and enhanced security and performance (Oracletimes.com).
It was a successful month for TRON thanks largely to two key favorable news items, which were followed by a sharp jump in price. The first was the announcement of the launch of the Tron test network on April 4 (Twitter), and the second was the listing of the cryptocurrency on the popular Bittrex exchange (Twitter).
The cryptocurrency exchange Binance and the Tron Foundation project also announced their strategic partnership with the Maltese authorities at the end of last month.The Cardano price increased on the back of positive news concerning a solution to the security problem of the proof of stake algorithm by the Cardano team (Cryptorecorder.com), as well as its listing on Binance and Huobi.
To identify more long-term cryptocurrency price trends, data on the price changes of the top 10 cryptocurrencies since the start of 2018 were also given (Fig. 3). The downward adjustment of the cryptocurrency market during the first quarter of 2018 was fairly severe, with only four cryptocurrencies (EOS, TRON, Stellar, NEO) from the presented top 10 worth more now than at the start of the year.
Figure 3. Price change in the top 10 cryptocurrencies by capitalization since the start of 2018, %
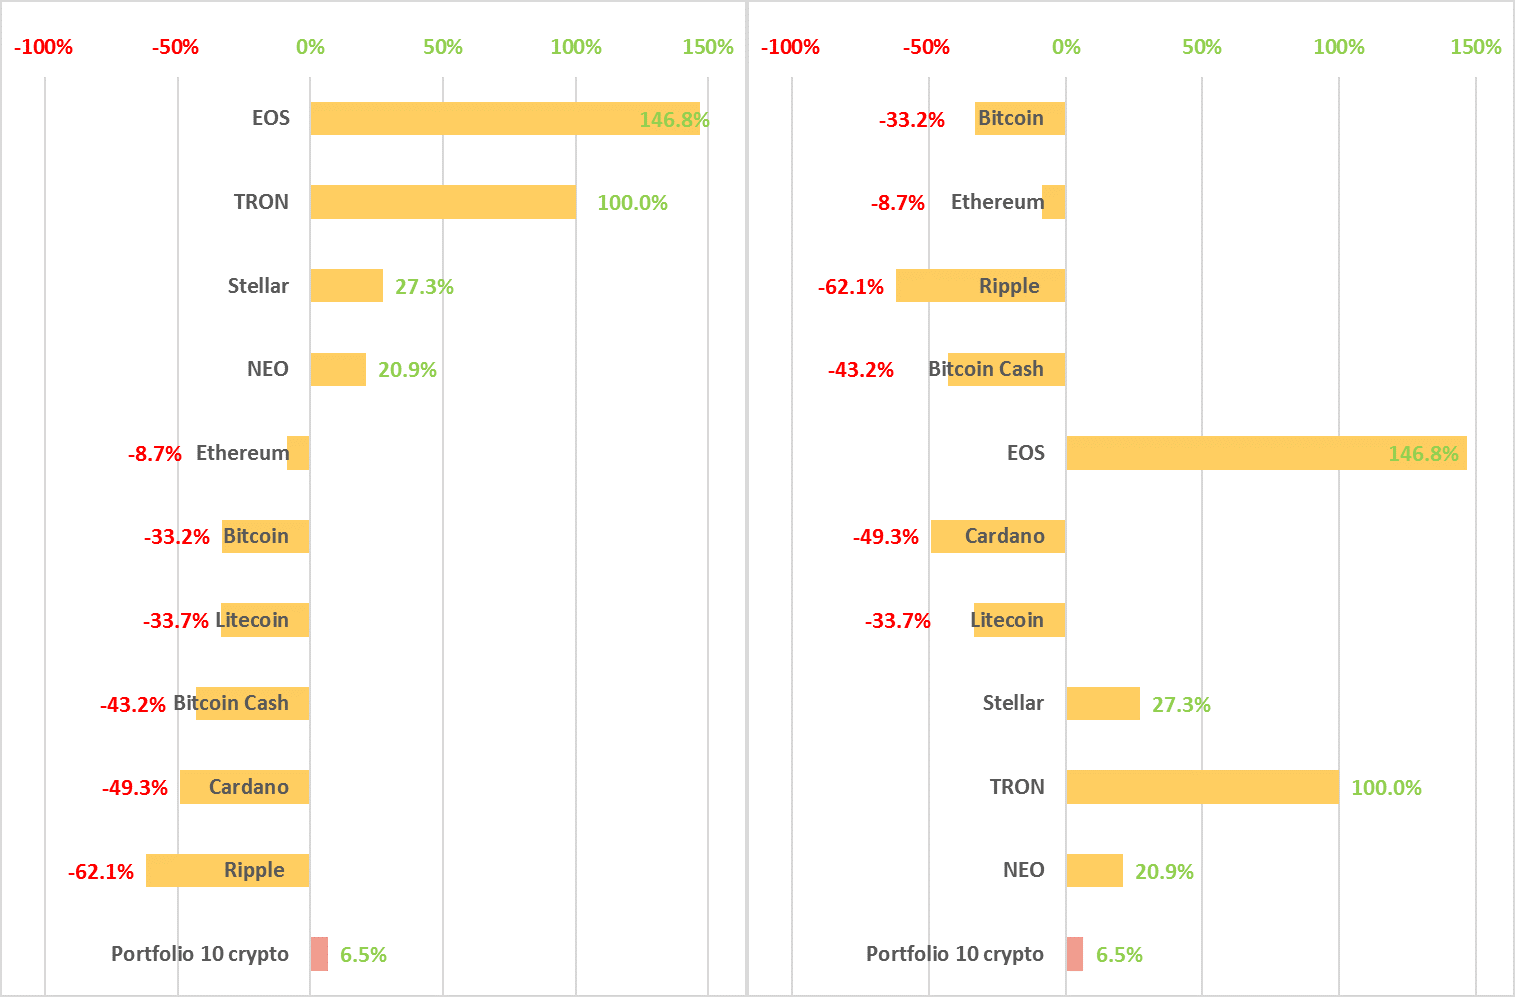
(on the left the cryptocurrencies are arranged by the level of price growth since the start of the year, and on the right – by the amount of capitalization as of May 1, 2018)
Calculation of the index of trading activity on cryptocurrency exchanges
To analyze trading activity on cryptocurrency exchanges, the ZAK-n Crypto index is calculated (see the Glossary). As of April 30, 2018, the trading volumes for the four dominant cryptocurrencies equaled $12.9 billion, i.e. 4.5% of their market capitalization (Table 1.3).
In April the 24-hour trading volumes (Volume 24h) for the four dominant cryptocurrencies (Bitcoin, Ethereum, Bitcoin Cash, Ripple) grew steadily from $6 billion to $13 billion (Table 1.3). The value of the daily ZAK-4 Crypto fluctuated from 2.7-6.8% of the amount of capitalization. The 24-hour trading volumes (Volume 24h) for the four and eight dominant cryptocurrencies during April nearly doubled (Tables 1.1, 1.3), which attests to the increased activity on cryptocurrency exchanges.
Table 1.3. Daily ZAK-4 Crypto index calculation (from April 1, 2018, to April 30, 2018)
| Crypto | Bitcoin (BTC) | Ethereum (ETH) | Bitcoin Cash (BCH) | Ripple (XRP) | 4 Crypto | ||||||||||
| Price Open | Volume (24h) | Market cap | Price Open | Volume (24h) | Market cap | Price Open | Volume (24h) | Market cap | Price Open | Volume (24h) | Market cap | Volume (24h) 4 crypto | Market cap 4 crypto | ZAK-4 Crypto index | |
| Date | $ | USD billion | USD billion | $ | USD billion | USD billion | $ | USD billion | USD billion | $ | USD billion | USD billion | USD billion | USD billion | % |
| Apr 30, 2018 | 9 426 | 8.7 | 160.3 | 690 | 2.9 | 68.4 | 1 441 | 0.8 | 24.6 | 0.87 | 0.6 | 34.1 | 12.9 | 287.4 | 4.5% |
| Apr 29, 2018 | 9 346 | 8.9 | 158.9 | 684 | 2.7 | 67.8 | 1 394 | 1.0 | 23.8 | 0.86 | 0.9 | 33.8 | 13.5 | 284.4 | 4.8% |
| Apr 28, 2018 | 8 939 | 7.8 | 152.0 | 645 | 2.5 | 63.9 | 1 338 | 0.8 | 22.9 | 0.81 | 0.8 | 31.8 | 11.9 | 270.5 | 4.4% |
| Apr 27, 2018 | 9 291 | 7.6 | 157.9 | 662 | 2.6 | 65.6 | 1 422 | 0.9 | 24.3 | 0.85 | 0.7 | 33.3 | 11.7 | 281.2 | 4.2% |
| Apr 26, 2018 | 8 867 | 9.0 | 150.7 | 618 | 3.0 | 61.2 | 1 290 | 1.3 | 22.0 | 0.80 | 1.0 | 31.4 | 14.3 | 265.4 | 5.4% |
| Apr 25, 2018 | 9 701 | 11.1 | 164.9 | 707 | 4.2 | 70.0 | 1 427 | 1.8 | 24.4 | 0.93 | 1.6 | 36.5 | 18.7 | 295.8 | 6.3% |
| Apr 24, 2018 | 8 934 | 10.7 | 151.8 | 643 | 3.6 | 63.7 | 1 434 | 2.1 | 24.5 | 0.88 | 1.6 | 34.3 | 17.9 | 274.3 | 6.5% |
| Apr 23, 2018 | 8 794 | 6.9 | 149.4 | 621 | 2.4 | 61.5 | 1 195 | 1.9 | 20.4 | 0.87 | 0.7 | 33.9 | 11.9 | 265.3 | 4.5% |
| Apr 22, 2018 | 8 925 | 6.6 | 151.7 | 606 | 2.4 | 60.0 | 1 147 | 1.0 | 19.6 | 0.87 | 0.9 | 33.9 | 11.0 | 265.2 | 4.1% |
| Apr 21, 2018 | 8 849 | 7.5 | 150.3 | 616 | 2.6 | 61.0 | 1 127 | 1.1 | 19.3 | 0.93 | 1.6 | 36.2 | 12.8 | 266.7 | 4.8% |
| Apr 20, 2018 | 8 287 | 8.4 | 140.8 | 568 | 2.8 | 56.2 | 970 | 1.0 | 16.6 | 0.79 | 2.3 | 31.0 | 14.6 | 244.5 | 6.0% |
| Apr 19, 2018 | 8 159 | 7.1 | 138.6 | 524 | 2.3 | 51.8 | 891 | 0.7 | 15.2 | 0.71 | 0.9 | 27.9 | 10.9 | 233.5 | 4.6% |
| Apr 18, 2018 | 7 944 | 6.5 | 134.9 | 503 | 1.8 | 49.8 | 758 | 0.6 | 13.0 | 0.66 | 0.6 | 25.7 | 9.6 | 223.4 | 4.3% |
| Apr 17, 2018 | 8 072 | 6.9 | 137.1 | 511 | 1.8 | 50.5 | 767 | 0.3 | 13.1 | 0.66 | 0.4 | 26.0 | 9.4 | 226.7 | 4.2% |
| Apr 16, 2018 | 8 338 | 5.6 | 141.6 | 532 | 1.8 | 52.6 | 781 | 0.4 | 13.3 | 0.68 | 0.5 | 26.7 | 8.3 | 234.2 | 3.5% |
| Apr 15, 2018 | 7 999 | 5.2 | 135.8 | 503 | 1.7 | 49.7 | 742 | 0.3 | 12.7 | 0.63 | 0.6 | 24.8 | 7.9 | 223.0 | 3.5% |
| Apr 14, 2018 | 7 875 | 5.2 | 133.7 | 493 | 1.5 | 48.7 | 739 | 0.3 | 12.6 | 0.64 | 0.6 | 24.9 | 7.6 | 219.9 | 3.5% |
| Apr 13, 2018 | 7 901 | 7.8 | 134.1 | 493 | 2.4 | 48.7 | 736 | 0.4 | 12.6 | 0.63 | 1.2 | 24.7 | 11.8 | 220.0 | 5.4% |
| Apr 12, 2018 | 6 955 | 8.9 | 118.0 | 430 | 2.5 | 42.5 | 666 | 0.4 | 11.4 | 0.54 | 1.3 | 21.1 | 13.2 | 193.0 | 6.8% |
| Apr 11, 2018 | 6 843 | 4.6 | 116.1 | 415 | 1.4 | 41.0 | 649 | 0.3 | 11.1 | 0.49 | 0.3 | 19.3 | 6.7 | 187.4 | 3.6% |
| Apr 10, 2018 | 6 795 | 4.3 | 115.3 | 399 | 1.2 | 39.4 | 638 | 0.2 | 10.9 | 0.49 | 0.2 | 19.2 | 5.8 | 184.9 | 3.2% |
| Apr 9, 2018 | 7 044 | 4.9 | 119.5 | 401 | 1.5 | 39.6 | 656 | 0.3 | 11.2 | 0.50 | 0.3 | 19.6 | 6.9 | 189.9 | 3.6% |
| Apr 8, 2018 | 6 920 | 3.7 | 117.4 | 386 | 0.9 | 38.1 | 641 | 0.2 | 10.9 | 0.49 | 0.1 | 19.1 | 4.9 | 185.5 | 2.7% |
| Apr 7, 2018 | 6 631 | 4.0 | 112.5 | 370 | 1.0 | 36.5 | 611 | 0.2 | 10.4 | 0.48 | 0.2 | 18.6 | 5.4 | 178.1 | 3.0% |
| Apr 6, 2018 | 6 816 | 3.8 | 115.6 | 383 | 1.0 | 37.8 | 642 | 0.2 | 10.9 | 0.49 | 0.2 | 19.3 | 5.2 | 183.6 | 2.8% |
| Apr 5, 2018 | 6 849 | 5.6 | 116.1 | 380 | 1.2 | 37.5 | 649 | 0.2 | 11.1 | 0.50 | 0.4 | 19.6 | 7.5 | 184.3 | 4.0% |
| Apr 4, 2018 | 7 456 | 4.9 | 126.4 | 416 | 1.3 | 41.1 | 710 | 0.3 | 12.1 | 0.55 | 0.4 | 21.7 | 6.9 | 201.3 | 3.4% |
| Apr 3, 2018 | 7 102 | 5.5 | 120.4 | 387 | 1.4 | 38.2 | 664 | 0.3 | 11.3 | 0.50 | 0.6 | 19.6 | 7.7 | 189.5 | 4.1% |
| Apr 2, 2018 | 6 845 | 4.3 | 116.0 | 380 | 1.1 | 37.4 | 644 | 0.3 | 11.0 | 0.49 | 0.3 | 19.0 | 6.0 | 183.5 | 3.3% |
| Apr 1, 2018 | 7 003 | 4.5 | 118.7 | 397 | 1.3 | 39.1 | 688 | 0.3 | 11.7 | 0.51 | 0.3 | 20.1 | 6.4 | 189.7 | 3.4% |
* Data as of May 1, 2018.
** Data source: coinmarketcap.com
Table 1.4 shows the main events that took place in early 2018 that had an impact on both the prices of the dominant cryptocurrencies and the market in general, with an indication of their nature and type of impact.
Table 1.4. Key events having an influence on cryptocurrency prices, April 23-30, 2018
| № | Factors and events
(link to source) |
Date of news | Description | Nature of impact | Type of impact |
| 1. | Iran’s Banks Banned from Dealing in Crypto-Currencies [source: BBC] | April 23, 2018 | According to the Iranian Central Bank, digital currencies can be used to launder money or support terrorism, as well as for transfers between criminals. It is notable that as late as February the Iranian authorities still had a more favorable opinion toward the cryptocurrency market. | Market ⇓ | Unfavorable |
| 2. | Bitcoin Price Hits Six Week High [source: Coinmarketcap] | April 23, 2018 | The price of the first cryptocurrency passed $9,200 for the first time since March 14, and total market capitalization exceeded $420 billion. | Market ⇑
|
Favorable |
| 3. | Goldman Sachs Hires Crypto Trader Justin Schmidt to Lead Digital Assets [source: Bloomberg] | April 23, 2018 | Well-known trader Justin Schmidt took the position of company vice president in the firm’s securities division and will be responsible for assessing the development prospects for a cryptocurrency strategy. | Market ⇑
|
Favorable |
| 4. | $150K Stolen from MyEtherWallet Users in DNS Server Hijacking [source: Coindesk] | April 24, 2018 | Users of MyEtherWallet, a web application for storage and transfer of tokens based on Ethereum, were the victims of a hacker attack on Tuesday, leading to losses of $152,000 worth of ether for users.
|
Market ⇓ | Unfavorable |
| 5. | 16 Exchanges Pledge to Restore Crypto Market Confidence [source: Coindesk] | April 24, 2018 | All 16 cryptocurrency exchanges that have been licensed in the country by the Financial Services Agency have united to create an association that will perform the functions of a self-regulatory organization. | Market ⇑ | Favorable |
| 6. | Nasdaq Would ‘Certainly Consider’ Becoming a Crypto Exchange, Says CEO [source: Coinspeaker] | April 25, 2018 | Adena Friedman, CEO of NASDAQ, has announced that the exchange “would consider becoming a cryptoexchange”, provided that “people are ready for a more regulated market, for something that provides a fair experience for investors.” | Market ⇑ | Favorable |
| 7. | Malta’s Cabinet Approves Cryptocurrency Bill [source: Bitcoin.com] | April 26, 2018 | One law regulates cryptocurrencies and the ICO process specifically, and the other two laws are concerned with regulation of digital innovations and technological services. | Market ⇑ | Favorable |
| 8. | CBOE Broke Record for Bitcoin Futures Volume [source: Investopedia.com] | April 27, 2018 | The number of transactions on the Chicago Board Options Exchange exceeded the average daily trading volume (6600) by nearly a factor of three. | Market ⇑
Bitcoin |
Favorable |
According to the data of the bitinfocharts resource (fig. 4), over the last three months a fairly close correlation has been seen between the indicators of the cryptocurrency market leaders: Bitcoin, Ethereum, Ripple (and to a lesser degree Bitcoin Cash and Litecoin).
Accordingly, one can safely say that outside events have had a nearly identical impact on these cryptocurrencies. It is believed that the closer the correlation coefficient is to one, the higher the similarity in the change in key indicators of cryptocurrency trends. The correlation coefficient on bitinfocharts is calculated as the average from correlations between different factors (transaction count, block size, number of tweets…) over the last three months. The trend of the remaining cryptocurrencies did not correlate as closely to the changes in the indicators of key currencies.
Figure 4. Correlation between cryptocurrencies
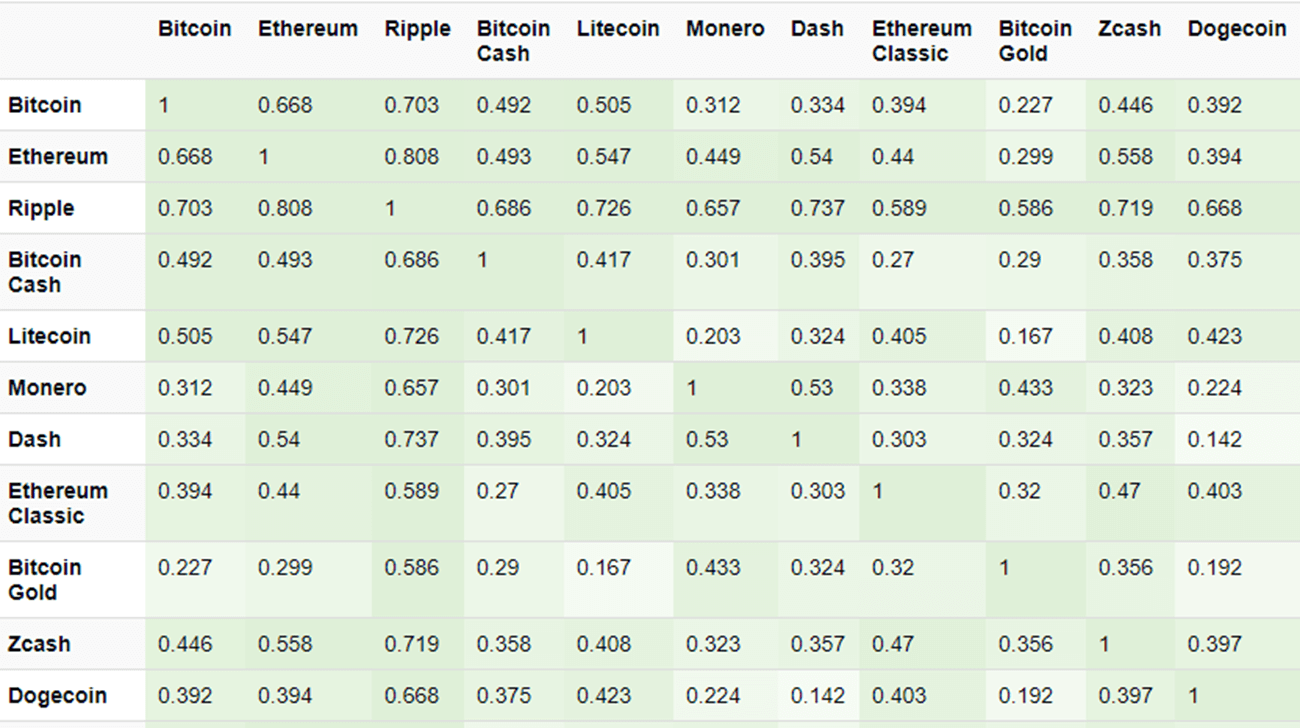
Data source: Bitinfocharts.com (data extracted on April 30, 2018)
Table 1.5 gives a list of events, information on which appeared last week, which could impact both the prices of specific cryptocurrencies and the market in general.
Table 1.5. Events that could have an influence on cryptocurrency prices in the future
|
№ |
Factors and events
(link to source) |
Date of news | Description | Nature of impact | Type of impact |
| 1. | Monex Leader on Crypto Exchange Regulation and Coincheck Acquisition [source: Bitnewstoday.com] | April 24, 2018 | Oki Matsumoto, the Managing Director of the major Japanese online broker, announced that digital asset exchanges must be regulated in the same way as banks, since they also manage assets of investors and offer trading platforms. | Market ⇓
|
Unfavorable |
| 2. | LinkedIn’s Co-Founder on Crypto Ad Bans and His New ‘Meta Social Network’ [source: Cointelegraph] | April 22, 2018 | American businessman and co-founder of LinkedIn, Eric Ly, has said that he does not think the bans will be permanent, and believes that they will be abolished “when regulatory clears itself up.” | Market ⇑
|
Favorable |
| 3. | CBOE Exchange Wants to Lower Its Bitcoin Futures Prices [source: Coindesk] | April 24, 2018 | The new rule is scheduled for approval after May 1. The changes will only apply to single-leg transactions for a specific scenario and will not affect spread transactions that require investors to buy or sell two different contracts simultaneously. | Market ⇑
|
Favorable |
| 4. | France Cuts the Crypto Tax Rate from 45% to 19%, Declares Bitcoin a ‘Moveable Property’ [source: Coinspeaker] | April 28, 2018 | The Conseil d’Etat (Council of State) of France has declared that cryptocurrencies should be seen as a “moveable property”, which means that the benefit received as a result of their sale should be taxed at a reduced rate. | Market ⇑
|
Favorable |
| 5. | Japan Finance Giant SBI Holdings to Launch Crypto Exchange in Summer 2018 [source: Cointelegraph] | April 30, 2018 | According to a recent announcement of company president Yoshitaka Kitao, the SBI exchange will support coins such as Bitcoin (BTC), Ethereum (ETH), Ripple (XRP), and Bitcoin Cash (BCH). | Market ⇑
|
Favorable |
1.2 Market trends
The weekly cryptocurrency and digital asset market trends from December 31, 2017, to April 30, 2018, are presented as graphs (Fig. 1.1-1.5)*.
Table 1.6. Legends and descriptions of the graphs
| Global Figures | Figure** | Description |
| Total cryptocurrency market capitalization, USD million | Fig. 1.1 | This figure shows cryptocurrency and digital asset market capitalization trends from December 31, 2017. |
| The rate of market change (as a % to the beginning of 2017) | Fig. 1.1 | This figure shows the % change in cryptocurrency and digital asset market capitalization compared to December 31, 2017. |
| Change in the market capitalization (in USD million compared to previous period) | Fig. 1.2 | This figure shows the weekly change in USD million (increase or decrease) in cryptocurrency and digital asset market capitalization from December 31, 2017. |
| The rate of market change (as a % compared to the previous period) | Fig. 1.2 | This figure shows the % of weekly change (increase or decrease) in cryptocurrency and digital asset market capitalization from December 31, 2017. |
| Number of cryptocurrencies and digital assets | Fig. 1.3 | This figure shows the trends in the increase of the number of cryptocurrencies and digital assets circulating on cryptocurrency exchanges. On January 1, 2017, their number was 617, and as of April 30, 2018, this number had already reached 1,563. |
| Average market capitalization, USD million | Fig. 1.3 | This figure reflects the growth in the average cryptocurrency and digital asset market capitalization from December 31, 2017, i.e. the ratio between the market capitalization of all cryptocurrencies and digital assets and their number. |
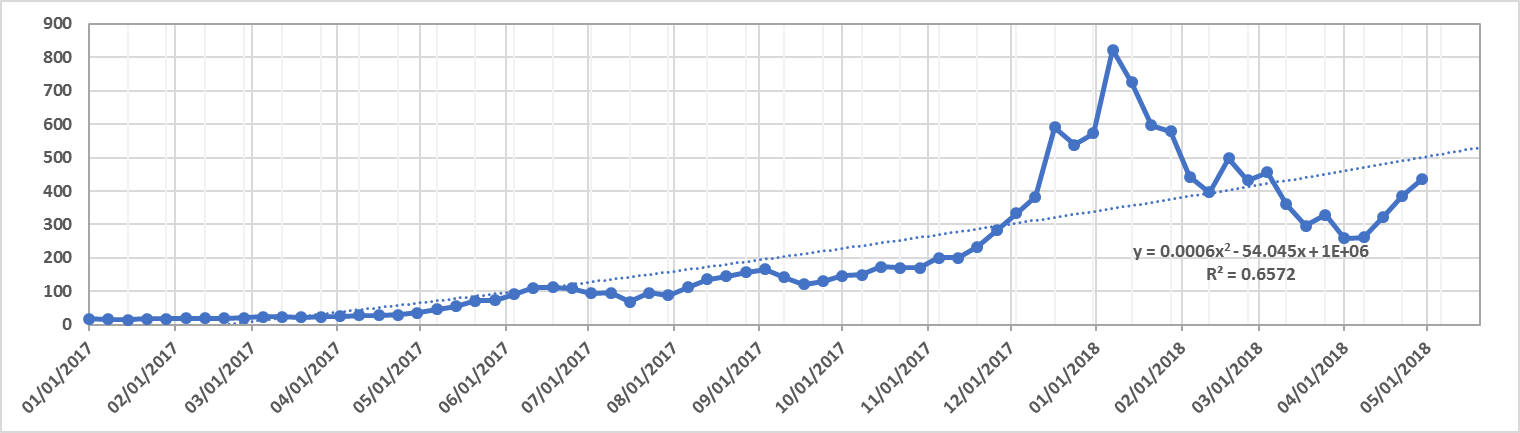
| Forecast of total cryptocurrency market capitalization | Fig. 1.4, 1.5 | This figure shows the time trend (forecast) change in cryptocurrency and digital asset market capitalization. |
* Data as of April 30, 2018, 00:00 UTC
** NB! Average daily data are given in the graphs below. For this reason, the figures in the graphs may differ from the data in Table 1.1, where all figures were calculated at 03:00 UTC.
These differences in the values may be significant during periods of high cryptocurrency market volatility.
Data source: coinmarketcap.com
Figure 1.1. Total cryptocurrency market capitalization*
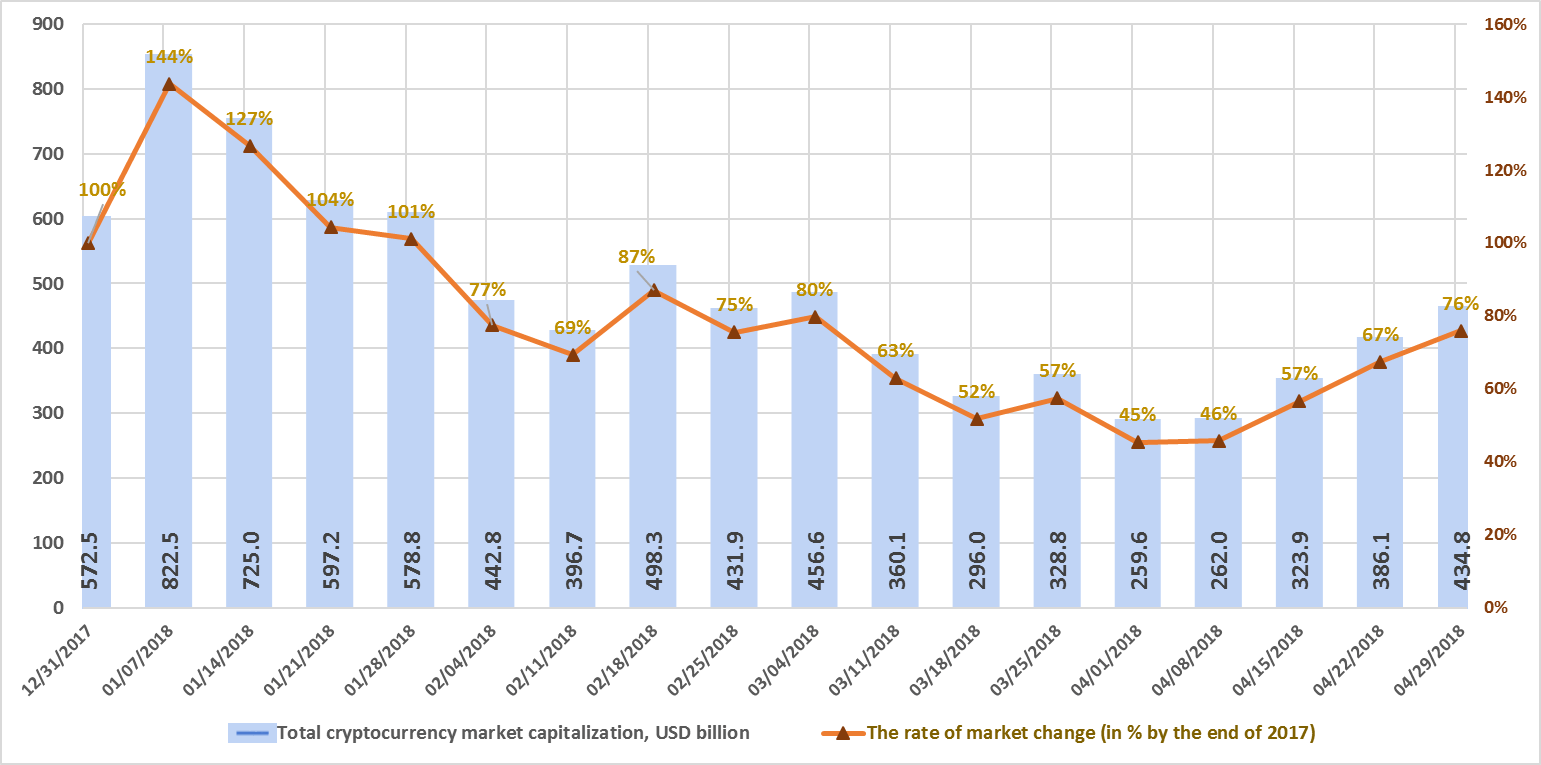
* Average daily data (according to the data of coinmarketcap.com).
Figure 1.1 shows a graph of the weekly cryptocurrency market change from December 31, 2017, to April 30, 2018. Over this period, market capitalization dropped from $572.5 billion to $434.8 billion, i.e. by 24%. Last week (April 23-29, 2018) cryptocurrency market capitalization increased from $386.1 billion to $434.8 billion (as of April 29, 2018, based on the average figures from coinmarketcap.com).
Figure 1.2. Change in market capitalization
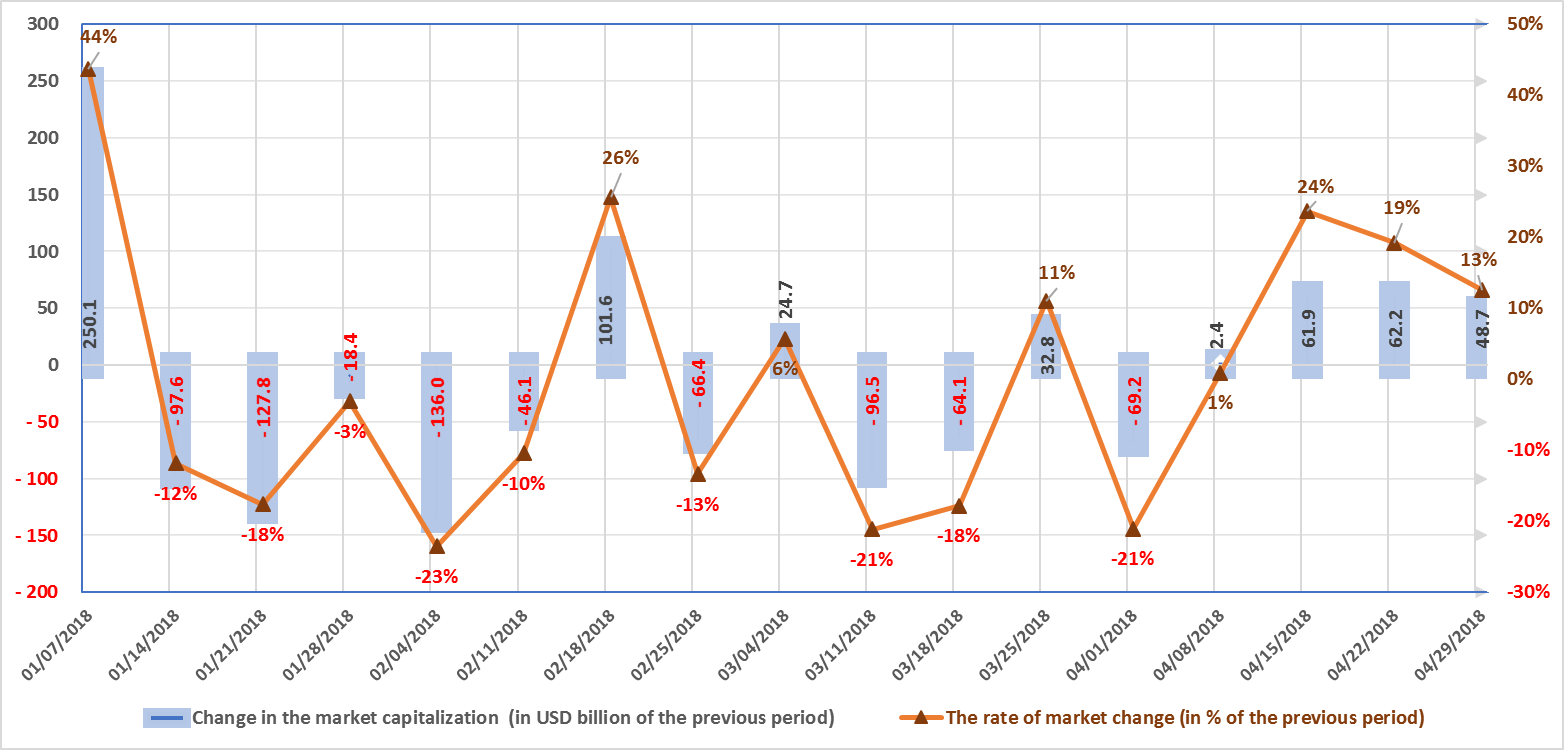
The market is susceptible to sudden and drastic fluctuations. During the first week of January, market capitalization increased by approximately $250 billion, or 44%. The largest weekly fall in the first quarter of 2018 was $136 billion, or 23%, during the week of January 28-February 4, 2018.
Nine of the thirteen weeks in the first quarter of 2018 were “in the red”, i.e. capitalization fell based on the results of each of these weeks. The market has grown over the past four weeks, including by $48.7 billion, or 13%, during the period from April 23-29 (with due account of average daily data, see Fig. 1.2).
Figure 1.3. Number of cryptocurrencies and digital assets
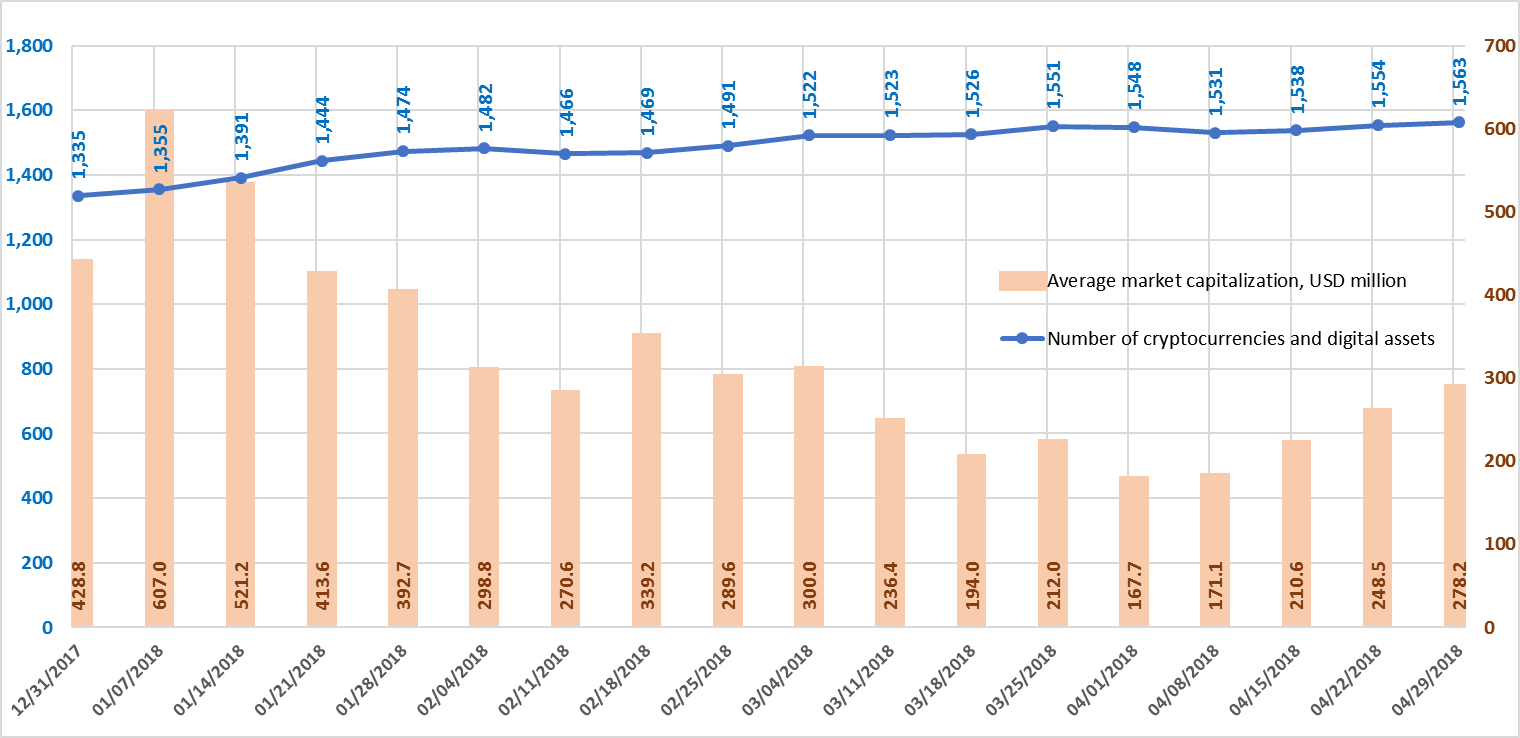
Data source: coinmarketcap.com
Since December 31, 2017, the total number of cryptocurrencies and digital assets considered when calculating market capitalization has increased from 1,335 to 1,563.
Their number increased by 9, from 1,554 to 1,563, over the past week, and average capitalization equaled $278.2 million. In total, over the past month 56 new coins and tokens have appeared on coinmarketcap.com (Cortex, TokenPay, Apex, Sentinel, Sentinel Chain, ODEM, XinFin Network, Dock, U Network, etc.). By way of example, the Cortex price has nearly tripled over the past two weeks. However, it should be noted that a number of other coins and tokens were also excluded from the list.
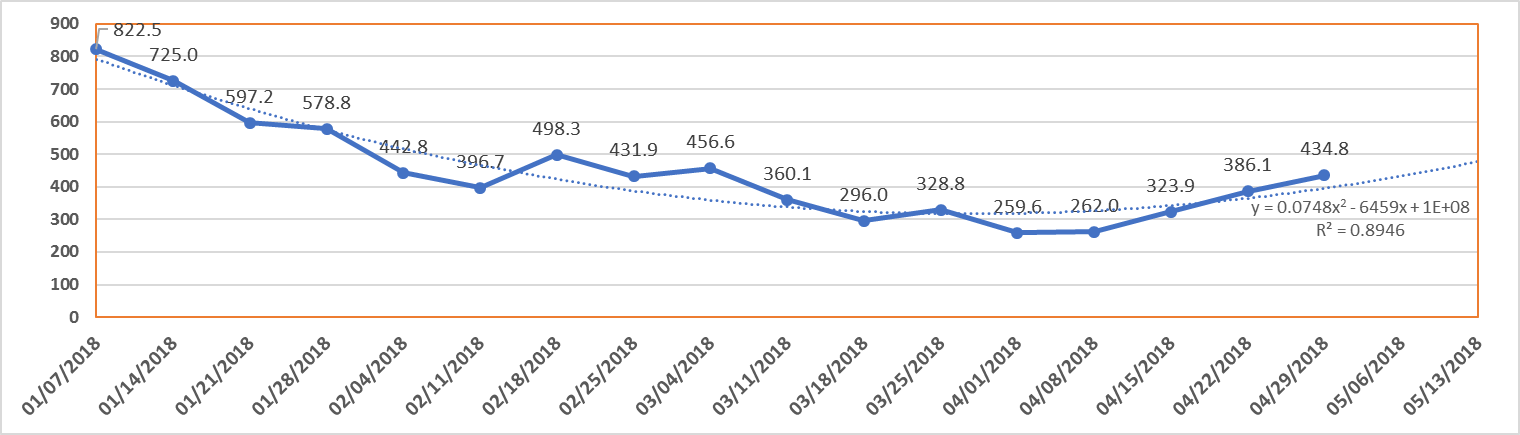
Figures 1.4 and 1.5. Forecast of total cryptocurrency market capitalization
More losses of cryptocurrency users were seen last week due to a hacker attack on the well-known wallet MyEtherWallet. Trailblazers in the emerging high-tech crypto industry are experiencing persistent instances of cryptocurrency losses due to phishing sites, theft, hacks and the appearance of scam projects.
We will cite a few examples: The DAO – 12 million ETH in 2016, Mt.Gox – around 850,000 BTC, Bitfinex – $65 million in BTC, NiceHash – $70 million in BTC, Tether – $30 million USDT, and just recently in 2018 Coincheck – $534 million in NEM. All this points to the fact that one of the industry’s crucial tasks in the near future is the creation of reliable security technologies for all types of cryptocurrency wallets, increasing the social responsibility of ICO projects and cryptoexchanges, including decentralized ones, and creating a user-friendly interface for transactions with cryptocurrencies.
Only if cryptocurrencies perform the five main functions (unit of value, medium of exchange, means of payment, store of value, universal money) will they become a fully-fledged alternative and/or addition to ordinary fiat currencies. Payment giant Mastercard is already working on harnessing the possibilities to use blockchain in financial settlements. Mastercard wants to patent a technology that makes it possible to quickly add new blocks to blockchain.
The second task is the creation of a transparent and reliable legal environment for the circulation of cryptocurrencies and holding ICOs. We were gladdened by Malta’s quick action and friendly tendencies in this area last week, as they approved three draft laws on blockchain and cryptocurrencies. Thanks to the friendly climate that has been established, the move of leading projects to Malta (including the Binance exchange), and the clear legislative framework, a large portion of global trade in cryptocurrencies now takes place on this small island.
Third task. The development of technologies to enhance the cooperation and competition between leading platforms. In particular, in April we witnessed a significant growth in the EOS tokens, which were issued on the Ethereum platform. EOS is preparing for the launch of its main network in June.
The introduction of EOS.io will mean the transition of EOS from the Ethereum blockchain to the main EOS network. The developers promise that this will have many positive effects, among other things the transition will facilitate an increase in speed, a reduction in costs, and enhanced security and performance.
Many already see EOS as one of the main competitors for Ethereum in terms of smart contracts (along with NEO, Qtum, Cardano, etc.). The advantages of EOS include scalability and a simplified interface for ease of use, with experts naming among its disadvantages the network’s overly centralized nature.
To compare the leading platforms, we will take information from the well-known resource coinmarketcap.com, which includes 712 tokens from 16 platforms (Ethereum, NEO, Omni, Qtum, Waves, Counterparty, BitShares, Ardor, Nxt, Stellar, Ubiq, NEM, NuBits, Ethereum Classic, Burst, Achain). Ethereum’s leading position in all categories (number of tokens on the platform, capitalization of issued tokens on the platform, turnover of tokens on the platform) is clear.
For example, the capitalization of issued tokens on the Ethereum platform accounts for 80-90%, and their turnover around 50%, of all tokens on the coinmarketcap.com resource (if calculations are made without taking Tether into consideration, the share of Ethereum-based tokens in circulation would be around 80-90%).
Naturally, this resource does not consider all coins and tokens, but it does include some of the most popular cryptocurrencies with the largest capitalization and turnover figures (at present, 1,563 coins and tokens).
The fourth task is to use blockchain technology for decentralization, and the creation of an infrastructure of data and business applications that could be used at the level of the state, corporations, and ordinary users. The ICO projects Filecoin, Storj, Genaro Network, Databroker DAO, Internxt, Neuromation, dadi and many others that are aimed at resolving this task have been held in 2017-2018.
In particular, in April the IBM Corporation announced its intention to create a production and sales chain monitoring platform together with the leaders of the jewelry industry. There are also examples of the use of blockchain technologies for national goals, which presupposes a higher level of centralized management. China has proposed “centralizing” blockchain in order to meet state needs and improve the reliability of financial operations.
The resolution of these practical tasks will ensure a multifold increase in capitalization of the cryptocurrency market, the turnover of which will grow by an order of magnitude.
Annex – Glossary
| Key terms | Definition |
| Market capitalization | Value of an asset calculated based on its current market (exchange) price. This economic indicator is used to assess the total aggregate value of market instruments, players, and markets. [Source: https://en.wikipedia.org]. |
| Cryptocurrency market capitalization | The market value of an individual coin or token circulating on the market. |
| Total cryptocurrency market capitalization | The market capitalization of cryptocurrencies and digital assets, i.e. the aggregate market value of cryptocurrencies and digital assets (coins and tokens) circulating on the market. |
| Dominance | Market share, i.e. the ratio of market capitalization of a particular cryptocurrency (coin, token) to total cryptocurrency market capitalization. Expressed as a %. |
| Not Mineable
|
A coin that is not mineable. The term is used for cryptocurrencies (coins, tokens) which cannot be mined or issued through mining. |
| Pre-mined | A pre-mined coin. The term is used for cryptocurrencies (coins, tokens) which are issued through mining, and a certain number of coins (tokens) have been created and distributed among certain users at the start of the project. |
| The rate of market increase (as a % compared to the beginning of the year) | The rate of market increase (as a % compared to the start of the year), i.e. by how many % points did market capitalization increase compared to the start of the year. |
| The growth rate of the market (as a % to the beginning of the year) | The rate of market growth (as a % compared to the start of the year), i.e. by how many times did market capitalization grow compared to the start of the year. |
| Increase in market capitalization (in USD million compared to the previous period) | Increase in cryptocurrency and digital asset market capitalization (in USD million compared to the previous period), i.e. by how many USD million did market capitalization increase over the period. |
| The rate of market increase (as a % compared to the previous period) | The rate of market increase (as a % compared to the previous period), i.e. by how many % points did market capitalization increase over the period. |
| The market growth rate (as a % compared to the previous period) | The market growth rate (as a % compared to the previous period), i.e. by how many times did market capitalization grow compared to the previous period. |
| Number of cryptocurrencies and digital assets | Number of cryptocurrencies and digital assets. At the beginning of 2018 over 1,300 cryptocurrencies and digital assets (coins and tokens) were circulating on the market. |
| Average market capitalization | Average market capitalization, i.e. the ratio of the market capitalization of all cryptocurrencies and digital assets to their number. |
| ZAK-n Crypto index | The index is calculated as a percentage and represents a ratio between the trading volume (transactions) on cryptocurrency exchanges per day (Volume 24h) for n dominant cryptocurrencies to their total market capitalization.
ZAK-4 Crypto index calculations include four dominant cryptocurrencies with the greatest market capitalization: Bitcoin, Ethereum, Bitcoin Cash, and Ripple. ZAK-8 Crypto index calculations include the trading volume and market capitalization for eight cryptocurrencies. |
The post Monthly Cryptocurrency Market Analysis [April 2018] appeared first on CoinSpeaker.