Bitcoin NVT Shoots Overheat Signal, Something To Worry About?
On-chain data shows the Bitcoin Network Value to Transactions (NVT) ratio is inside the overheated territory currently. Here’s what this could mean.
Bitcoin NVT Golden Cross Has Surged Into Overheated Territory
As pointed out by an analyst in a CryptoQuant Quicktake post, the market cap of the asset may be overvalued right now. The “NVT ratio” is an indicator that measures the ratio between the Bitcoin market cap and transaction volume.
When the value of this metric is high, it means that the asset’s value (that is, the market cap) is significantly more than the network’s ability to transact coins (the transaction volume). Such a trend can suggest the coin may be overvalued right now.
On the other hand, the indicator being low implies the cryptocurrency may be underpriced at the moment as the blockchain’s transaction volume is relatively high currently.
In the context of the current discussion, the NVT ratio itself isn’t of focus, but rather a derivative metric called the “NVT Golden Cross” is. This indicator aims to pinpoint tops and bottoms in the NVT ratio by comparing its short-term trend (10-day MA) with its long-term trend (30-day MA).
Now, here is a chart that shows the trend in the Bitcoin NVT ratio over the last few years:

In the graph, the quant has marked the two regions historically of interest for the Bitcoin NVT Golden Cross. Generally, the metric being above the 2.2 level implies that the market is overvalued, while it being below -1.6 suggests the asset is underbought.
From the chart, it’s visible that the indicator has registered some sharp growth recently and has just made a touch of the overpriced territory. This suggests that following the latest rally, the asset has started to become overheated.
While the metric being in this region raises the chances of a correction, it doesn’t necessarily mean one has to happen. As the analyst has highlighted in the chart, the indicator breaching the zone has been something that has happened in all recovery phases.
The cryptocurrency initially keeps going despite this pattern in the NVT Golden Cross; it’s only with further breaches into the territory that the asset closes in on a top. Thus, it’s possible that the Bitcoin price could continue its rally for now even after the indicator surges into the bearish region.
In some other news, the adoption of BTC appears to have been ramping up recently, as the total number of new addresses being opened every day has seen some sharp growth. The below chart shared by an analyst on X shows this trend.
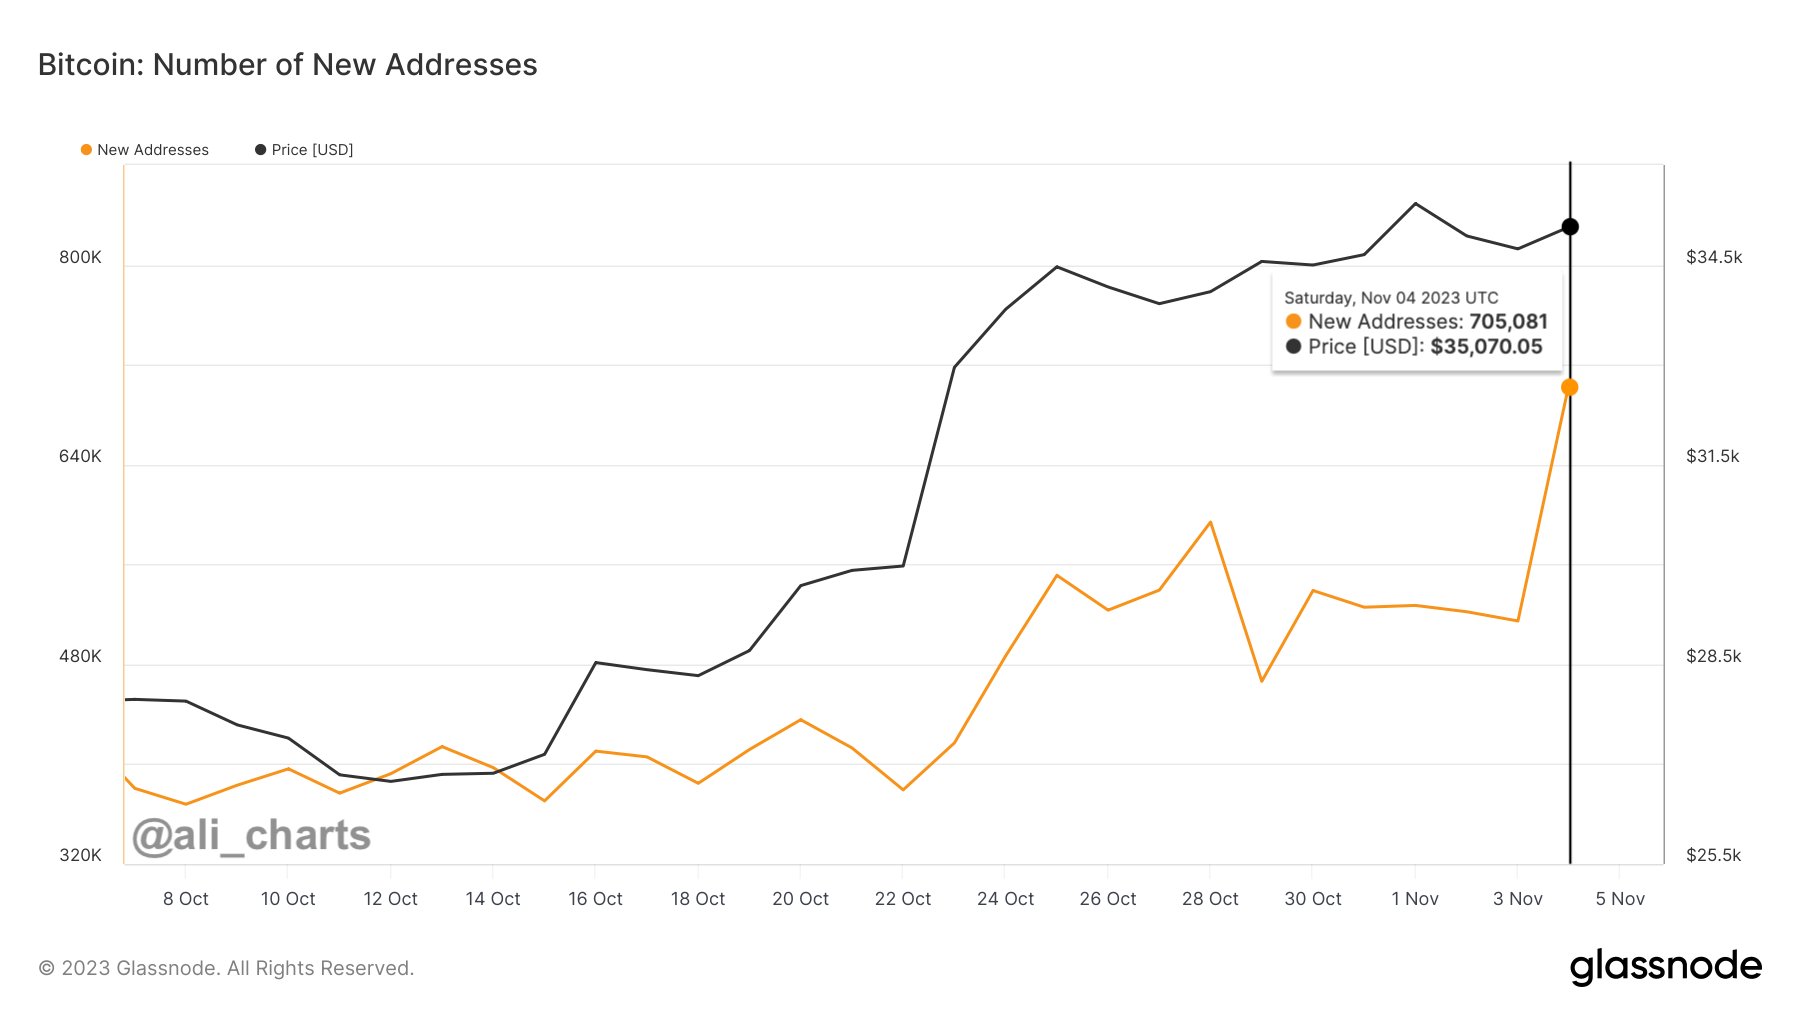
Adoption is usually a constructive sign for the network. In the context of the NVT ratio, more users could potentially mean a higher transaction volume, which should result in the market becoming less overheated.
BTC Price
At the time of writing, Bitcoin is trading at around $35,000, up 1% in the past week.