Bitcoin On Schedule: Current Profits Line Up With Previous Cycles
Data shows the current Bitcoin cycle is lining up against the historical ones in terms of the returns that the asset has seen since hitting its bottom.
Previous Bitcoin Cycles Had Similar Returns At This Stage
As pointed out by CryptoQuant Netherlands community manager Maartunn in a post on X, there seems to be a remarkable similarity between the current cycle and the previous ones.
Below is the chart shared by the analyst, which compares the price performance of each Bitcoin cycle, starting with the bottoms of the respective bear phases.
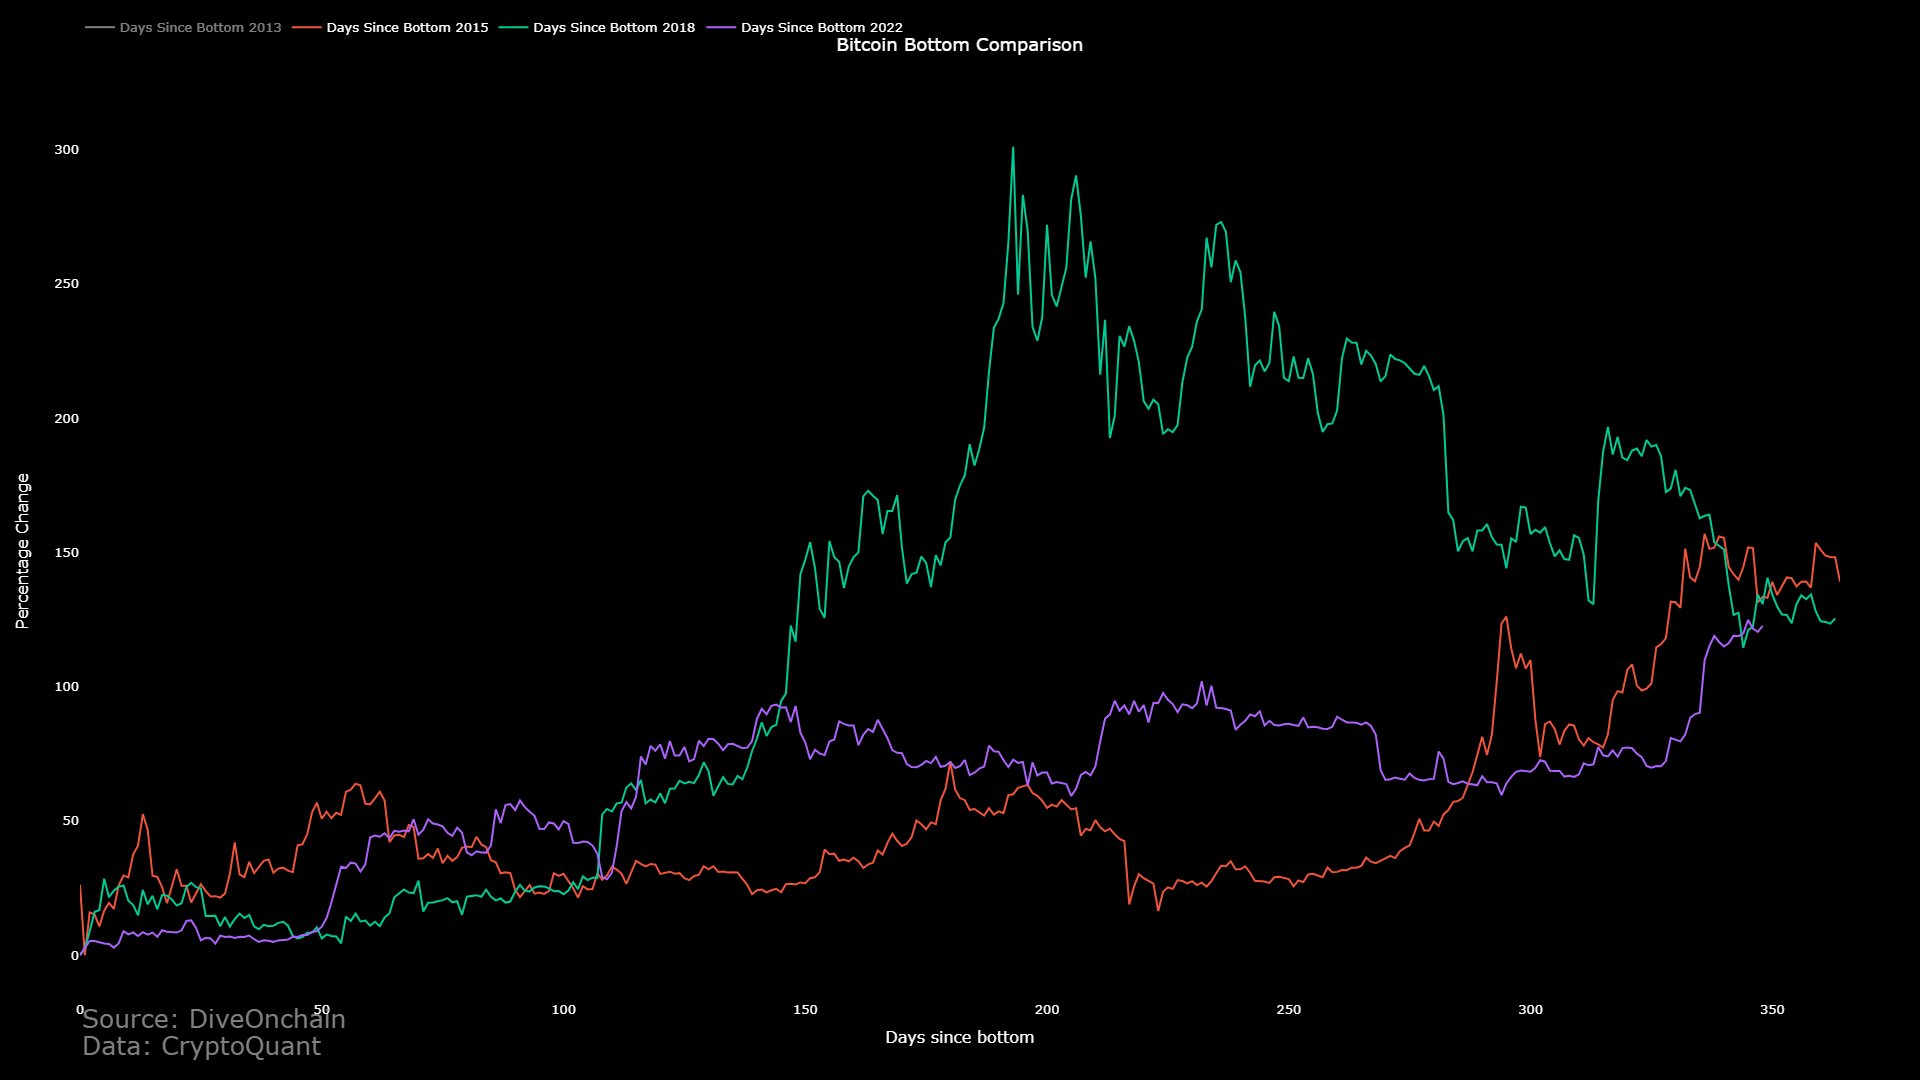
This chart naturally makes use of the assumption that the low observed after the FTX collapse back in November 2022 was the bottom for the current Bitcoin cycle.
From the graph, it’s visible that all three cycles observed relatively close price action for the first 100 or so days after the formation of the respective cyclical lows.
After this point, the cycles showed some divergence. The last cycle, in particular, displayed price action that was significantly detached from that of the current cycle or the cycle before that one.
The last two cycles started to converge 300 days after the bottom and successfully did so by the 350th mark. Recently, the current cycle has reached the same milestone, and interestingly, it has converged with the others.
With the latest rally in the price towards the $35,000 level, BTC is up approximately 120% since the bottom, similar to the returns seen in the last two cycles.
As is apparent from the chart, following this point of convergence, the cryptocurrency moved sideways in both of the previous two cycles. If this is anything to go by, BTC may also be going through a similar phase of consolidation soon in the current cycle as well.
Another analyst, James V. Straten, posted on X today discussing the similarity between the different Bitcoin cycles from another perspective. In particular, the analyst has talked about how the chart of the loss supply of the BTC long-term holders looks similar for each cycle.
The “long-term holders” (LTHs) refer to the investors holding onto their coins since at least 155 days ago. The chart below shows the trend in the total supply in loss held by these HODLers throughout the asset’s history.
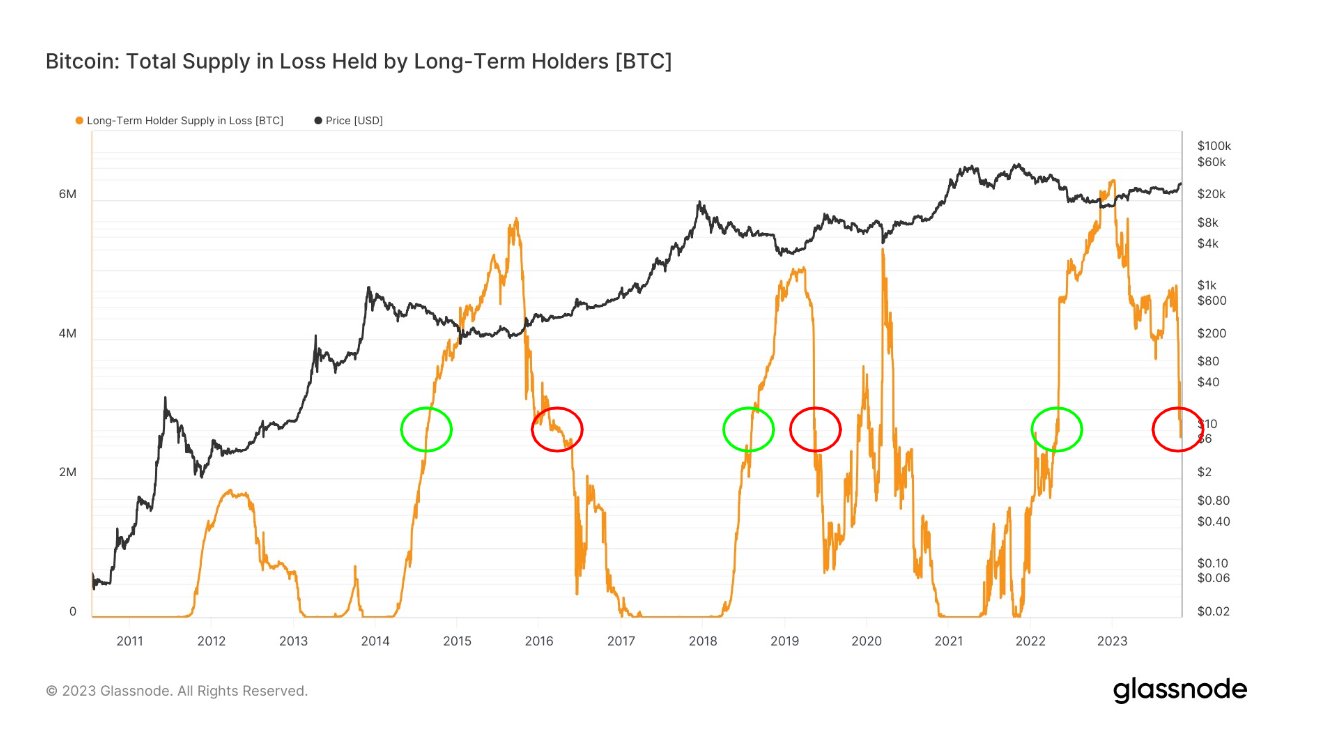
At present, the Bitcoin long-term holders are carrying 2.6 million BTC in loss. As Straten has highlighted in the chart, this level is in line with what the indicator’s value was when the cryptocurrency was exiting the bear market in previous cycles.
BTC Price
At the time of writing, Bitcoin is trading at around $34,800, up 1% in the past week.