Ripple (XRP) Price Analysis: The Bears Have Taken Over But Possible Incoming Bullish Spike

Supply zones: $0.62, $0.79, $0.88,
Demand zones: $0.43, $0.33, $0.26
XRP/USD Medium-term Trend: Bearish
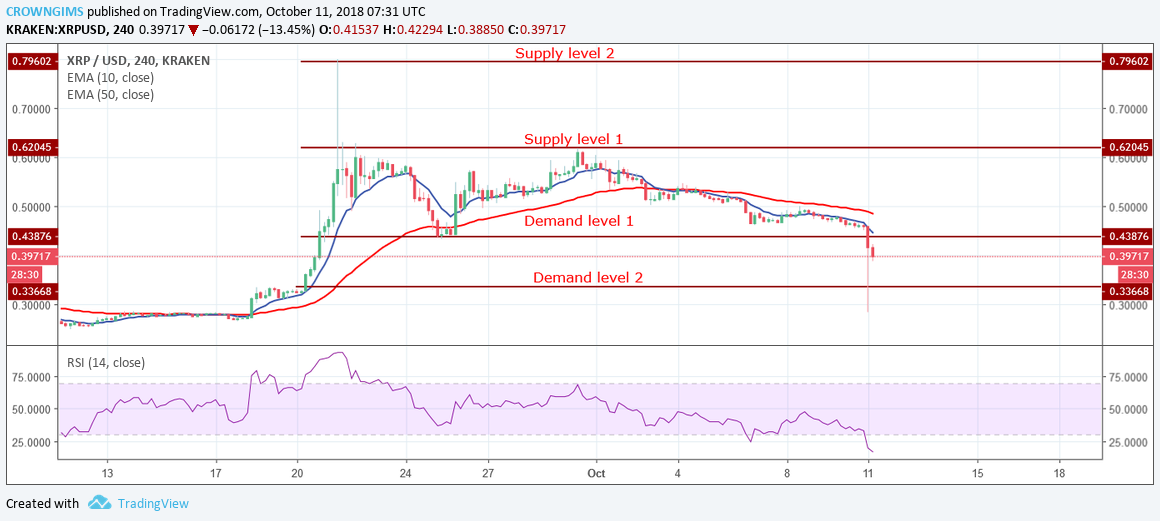
Yesterday, October 10 XRP was in a bearish trend. Immediately the market headed towards the supply level of $0.62 and continuation of the bullish movement was rejected by the bears with the formation of strong bullish candles at the supply level of $0.6 on the September 30, the coin has been trending down towards the support level of $0.43.
Today, the market opening candle was a strong bearish candle that broke out to the south of the support level of $0.43; the price was pushed down to the lower support level of $0.33. The bears increased their momentum and broke the support level of $0.33 and the coin was exposed to the lower support level of $0.26. The price may experience pullback at this level.
XRP is currently below 10-day EMA and 50-day EMA with the both EMAs well separated and point to the south, which indicates a bearish trend is ongoing. The RSI period 14 is below 25 level with its signal line pointing downward, which indicates a sell signal.
XRP/USD Short-term Trend: Bearish

On the short-term, XRP/USD is bearish. The price was above the support level of $0.43 yesterday. The bears gained more momentum and pushed the price below the support level of $0.33. It immediately experienced retracement by the pressure from the bulls.
The coin is below 10-day EMA and 50-day EMA which suggests a further decrease in price. Nevertheless, RSI period 14 is below 20 levels (oversold region) with its signal line points to the north, which indicates the probability of price reversal which may be temporary before its bearish continuation. Traders should be patient and discipline in taking a position.
The post Ripple (XRP) Price Analysis: The Bears Have Taken Over But Possible Incoming Bullish Spike appeared first on ZyCrypto.