Dogecoin Targets $0.24 Breakout: Will Volume Spikes Push It Past $0.1759 Resistance?
- Dogecoin eyes $0.24 breakout as volume surges 23%.
- $0.16 proves strong support with rising accumulation interest.
Dogecoin (DOGE) is once again making a splash, as it sits at a pivotal point in its price evolution. DOGE is priced at $0.1691 at the time of writing, representing a 1.16% gain in the prior 24 hours. But the charts tell us that there’s greater volatility ahead and potential changes that it must absorb. With a market cap of $25.15 billion and a circulating supply of 148.72 billion DOGE, this meme coin has a solid following among traders. So, what do the charts indicate about the next move in DOGE?
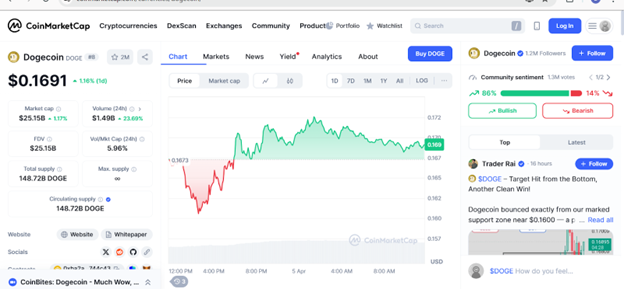
Source: CoinMarketCap
Is Dogecoin Set for a Long-Term Breakout?
A recent post by analyst Ali on X, The weekly chart from TradingView depicts a longer time frame on DOGE price action. DOGE is currently priced at $0.17023, which is 2.88% below its recent high of $0.1759.
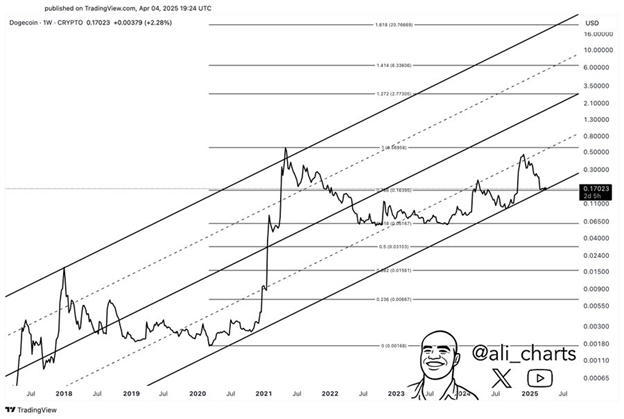
source: TradingView on X
DOGE is still trading in an ascending channel that began back in 2018, with major support at $0.115 and $0.086. The price bounced from the lower trendline of the channel at approximately $0.115 in early 2024 before climbing towards $0.17 recently. Additionally, DOGE is at a new resistance of $0.1759. If the bulls manage to break this resistance, the next target and resistance is at $0.24 – a rally of 41%. Alternatively, if DOGE is unable to hold $0.16 then it is likely DOGE will retest the $0.115 support.
RSI and MACD: Are Bears in Charge?
DOGE’s current momentum is reflected in the technical indicators. The 1-day chart shows an RSI of 43.89, which is in the ballpark of the oversold region, around 40; if buyers show up a bounce is indicated. The MACD indicates bearish sentiment, as the MACD line (-0.00106) is below the signal line (-0.00742) with a histogram of -0.00848. On the weekly chart, we see a possible bounce as DOGE approaches a long-term support trendline at about $0.165.

Source: TradingView
Volume Surge at $0.16: Is Dogecoin Gearing Up for a Big Rally?
The volume trends for DOGE as shown over time, where a recent spike aligns with the price drop to $0.16. The 24-hour trading volume is $1.498 billion and up 23.69%, which suggests the activity has increased. Historically, spikes in volume have indicated significant moves in price are to follow. An example would be the massive volume jump in mid-2021, which coincided with DOGE rallying to $0.73. As it stands now, the volume bars indicate there is buying interest at approximately the $0.16 level, indicating accumulation. This means this level could be a strong support level, and if sentiment changes, it may provide a rebound in price.
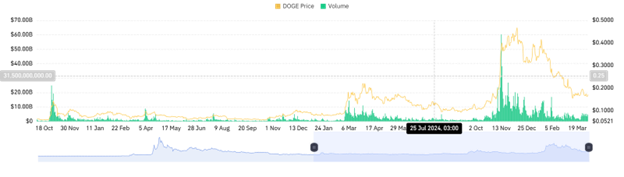
Source: Coinglass
Final Verdict: Will Dogecoin Rally?
Dogecoin finds itself at a crossroads today. The $0.16 support level holds strong with rising volume and has an RSI near oversold. However, the bearish MACD indicates caution. If the bulls can take out $0.172, DOGE could push for the $0.19 target. But failing at and breaking below $0.16 could see DOGE retest $0.15. Despite the bearish factors short-term, we believe DOGE’s volume and historical support levels hint at a possible bounce. All eyes will be on $0.16; the bulls might have the last laugh.
The post Dogecoin Targets $0.24 Breakout: Will Volume Spikes Push It Past $0.1759 Resistance? appeared first on Live Bitcoin News.