Daily Cryptocurrency Analysis: December 5th Updates

Across the cryptocurrency markets, the Bears overpowered the Bulls as prices succumbed to a bearish trend. This adds onto the woes that have befallen cryptos since the BCH hard fork last month. As will be seen below, previous supports were tested and breached as the downward trend gains momentum.
Investor confidence is also resuming slowly as the Relative Strength Index (RSI) on most charts moves from the ‘oversold’ zone into the middle, signaling an attainment of equilibrium between buying and selling.
Bitcoin (BTC)
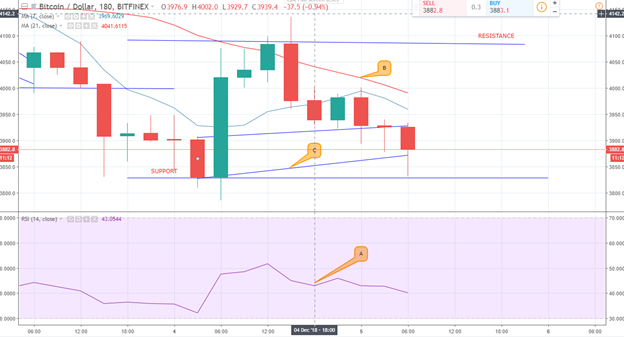
Summary
- Despite a bearish outlook, it gained 0.56% over the last 24hours; from $3903 to $3925.
- Resistance is at around $4080 and Support at around $3880.
- Price patterns form a Contracting triangular pattern. (C)
The biggest altcoin continues to be faced by volatility as its prices keeps descending. Over the last 24 hours, it hit a high of $4135 and a low of $3810. The recent Bullish wave that saw prices move upwards after the fork came to a halt as it saw a downtrend.
As seen in C above, prices tended towards a Contracting triangular pattern from the support line, a strong indicator of the Bearish wave.
B shows the 21 day moving average above the 7 day EMA indicating a bearish trend. Lastly, the RSI (as seen in point A) is at the middle zone, indicating improved investor confidence. In the last 24 hours, BTC’s trading volume was $4.9 Million.
Litecoin (LTC)
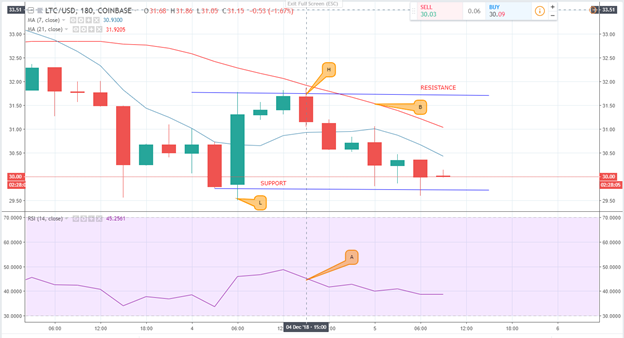
Summary
- Litecoin lost by 1% over the last 24 hours, moving from $30.67 yesterday to $30.36 today.
- Support was at around $29.70 and Resistance at around $31.70.
- In the markets, buying pressure has attained equilibrium with RSI at the middle zone.
Litecoin has also been faced with volatility. Initially, support held at $27.3 and Resistance at $35.37 against today’s figures as shown in the summary.
In the chart, as seen in A, the Relative Strength Index (RSI) bounced back into the middle zone from the ‘oversold’ region. This goes to show improved investor sentiments.
On the upper side, the price was $31.86 (marked H) and $29.50 (marked L) on the lower side.
B shows both moving averages on the downtrend, a strong signal of the bearish momentum that has hit the markets. This is coupled by the fact that the 21 Day EMA was below the 7 Day EMA over vast periods of the day.
Forecast
In conclusion, majority of the indicators in the charts point towards a bearish outlook with a small chance of intermittent Bull Runs in the days to come.
The post Daily Cryptocurrency Analysis: December 5th Updates appeared first on ZyCrypto.