Crypto Price Analysis January 22: BTC, ETH, BSV, BCH, LTC
Coinspeaker
Crypto Price Analysis January 22: BTC, ETH, BSV, BCH, LTC
Dmitriy Gurkovskiy, a senior analyst at foreign exchange broker RoboForex, shares his insights into the future scenarios for Bitcoin price movement as well as possible price swings of major altcoins.
Digital asset prices are still making buyers happy. As we can see, bulls continue putting pressure. Even if assets fail to break their respective resistance levels in the short-term, the correction will provide an opportunity to enter the market at lower prices.
Bitcoin chart shows another reversal pattern. If the cryptocurrency falls towards $6875.00, growth potential will remain at $12000.00. Most likely, such movement may be considered as some kind of a pause for bulls before they continue pushing the price upwards.
Other assets are also may continue trading upwards but it’s very important to remember that the price quite often rebounds downwards after testing the resistance level. From the technical analysis points of view, an excellent moment for purchasing can be found when an instrument finishes its correction or breaks the resistance area.
Bitcoin
In the daily chart, Bitcoin is testing the descending channel’s upside border. In order to continue a proper rising movement, bulls must fix the price above $9800.00, thus breaking the above-mentioned channel. Another thing that confirms this “further-growth-scenario” is a breakout of the downtrend line at RSI, which also indicates that the correction is over and the price may resume the bullish trend. However, one shouldn’t exclude a possibility that the instrument may plunge from the current levels and test the support at $6875.00. In this case, the pair may form Inverter Head & Shoulders pattern. That’s why one can expect the price to fall, but then start a new growth with the target at $12965.00. Still, this scenario may no longer be valid if the market breaks the local low and fixes below $5890.00. As a result, $6875.00 may be a conservative area for bears, but bullish pressure may prevent this opportunity.
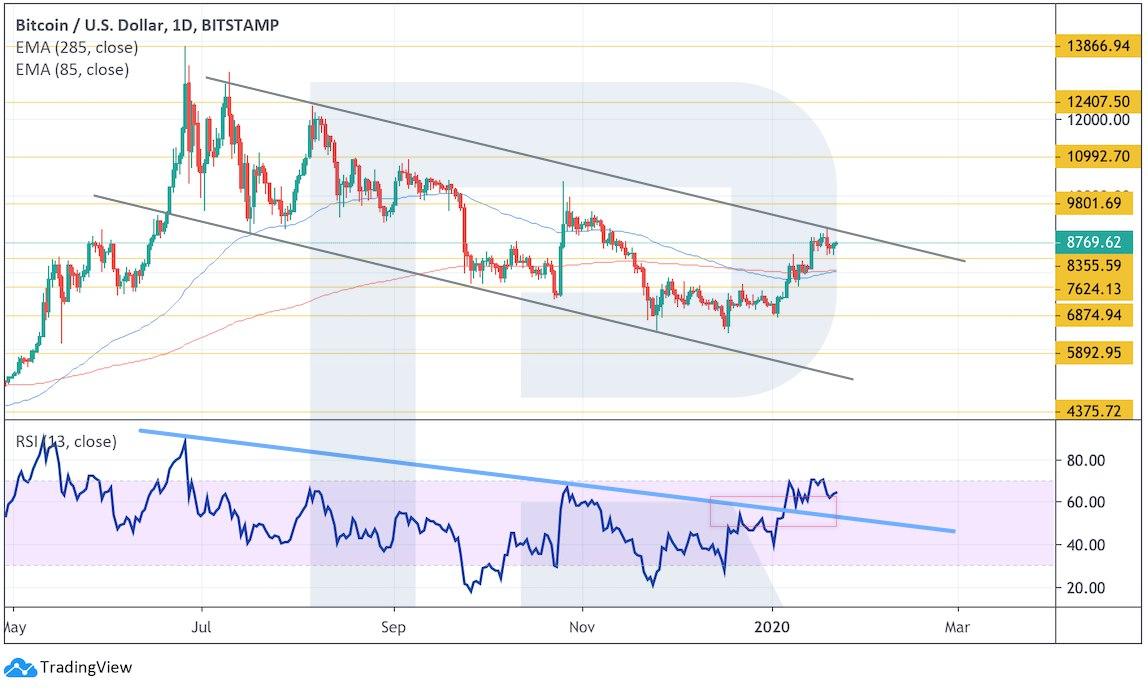
Photo: Roboforex / TradingView
As we can see in the H4 chart, Bitcoin continues trading upwards; Moving Averages indicate a bullish tendency. The major trading idea implies that the instrument may fall to test the support at $8355.00 and then resume growing. This scenario may be confirmed by a rebound from the rising channel’s downside border and a test of the support line at RSI. As we can see, the indicator already rebounded from this line earlier. However, this scenario may no longer be valid if the pair plummets and breaks $7625.00. after that, the market may continue trading downwards with the target at $6875.00.
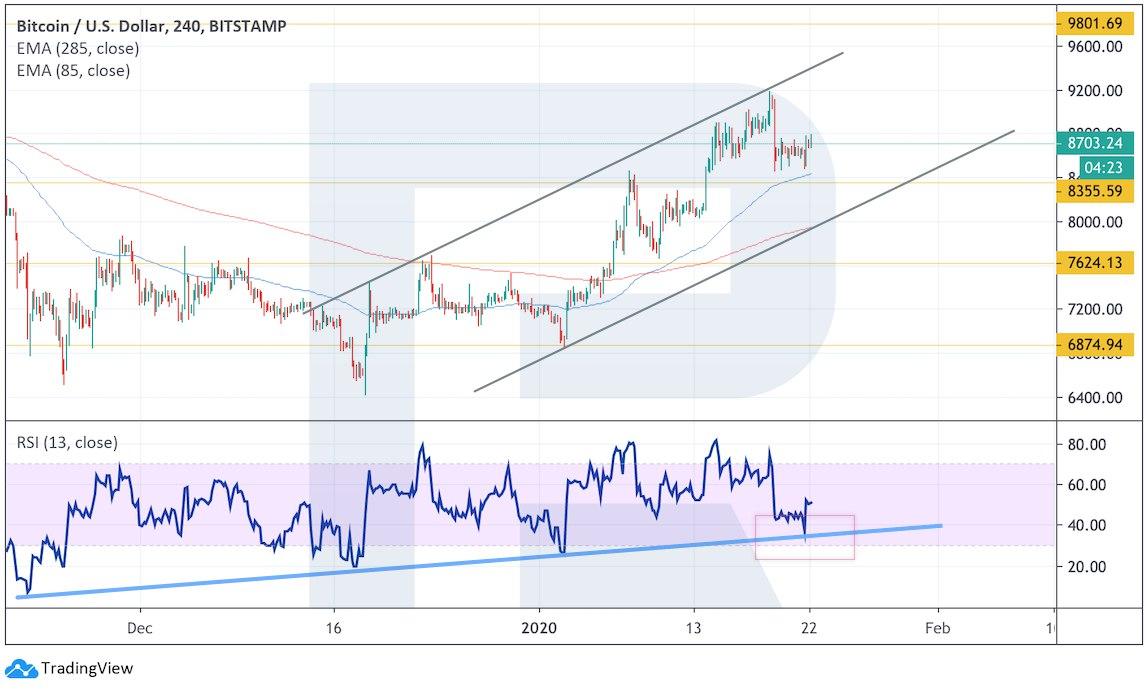
Photo: Roboforex / TradingView
Ethereum
In the daily chart, Ethereum is trading between Moving Averages again, which indicates a descending tendency. One can expect the instrument to fall from these levels with the first target at $130.00. Another signal to confirm this possible movement is the price’s rebounding from the descending resistance line and testing the descending channel’s upside border. In order to start a proper rising movement, the pair must break $202.00, thus breaking the above-mentioned channel. So far, the bearish pressure continues.
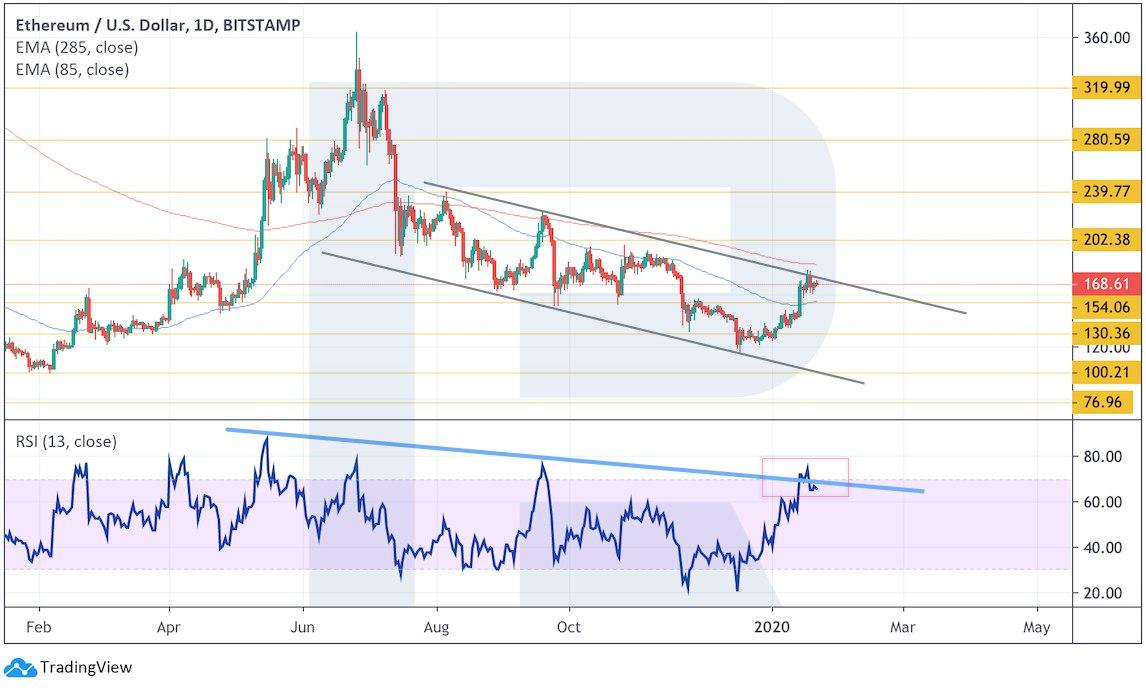
Photo: Roboforex / TradingView
As we can see in the H4 chart, the pair is forming Head & Shoulders reversal pattern, which indicates its attempt to fall from the current levels towards the support at $138.00. Another thing that confirms this “decline” scenario is a breakout of the uptrend line at Relative Strength Index. The trading idea may also be confirmed by a breakout of $156.00 to indicate that the reversal pattern is completed. However, this scenario may no longer be valid if the price skyrockets and breaks $180.00. In this case, the reversal pattern will be cancelled and the digital asset price will continue trading upwards.
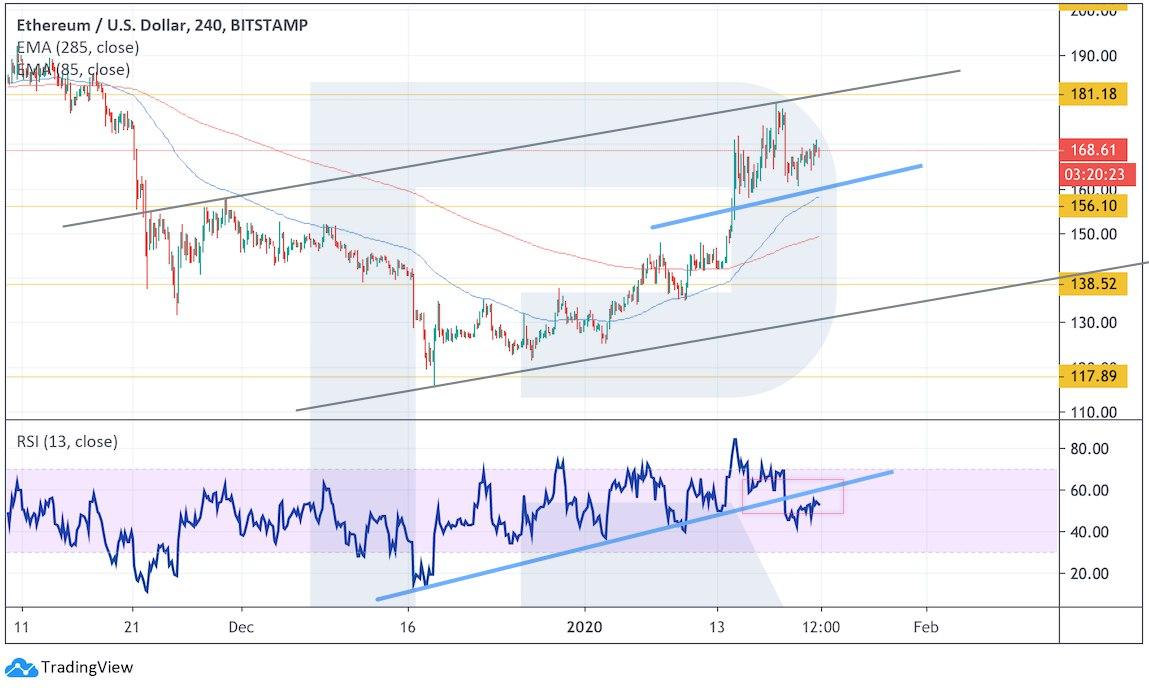
Photo: Roboforex / TradingView
Bitcoin SV
In the daily chart, Bitcoin SV is correcting, but may yet continue trading upwards; the price has fixed above Ichimoku Kinko Hyo cloud, which also indicates an ascending impulse. The closest support area is at $256.00. Later, the pair is expected to test the rising channel’s downside border and then resume growing with the first target at $460.00 However, this scenario may no longer be valid if the instrument falls to break the cloud’s downside border and fixes below $165.00. After that, the asset may continue falling to reach $75.00.
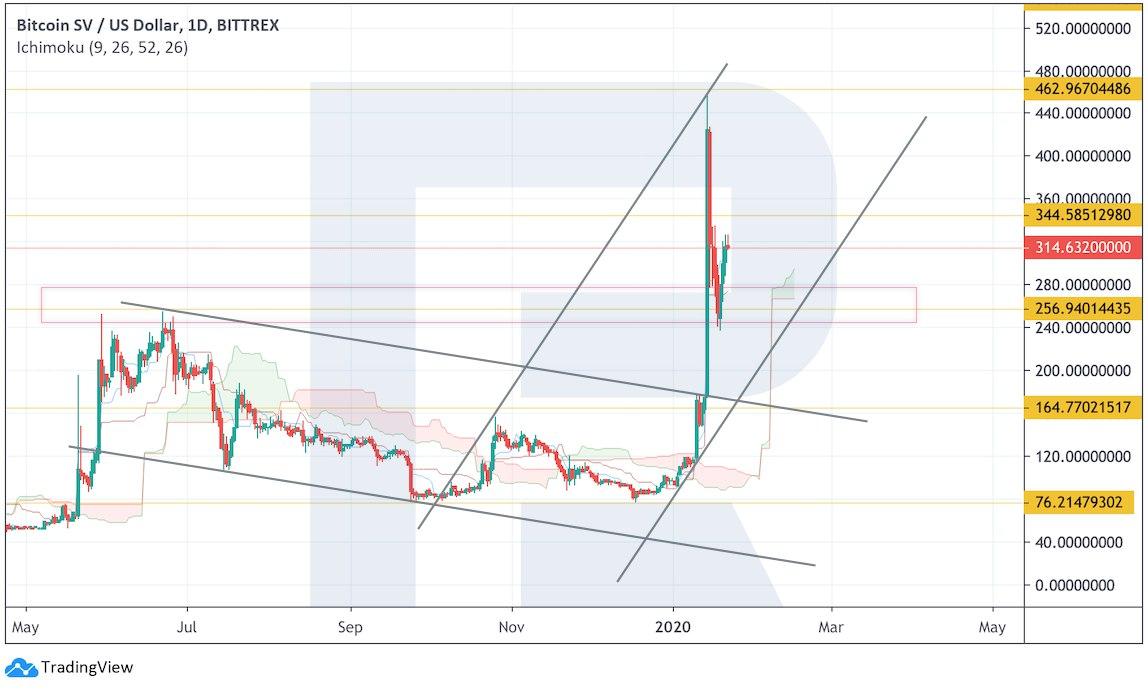
Photo: Roboforex / TradingView
At shorter timeframes, Bitcoin SV is also moving above Ichimoku Kinko Hyo cloud; it may form Inverted Head & Shoulders reversal pattern. The price is expected to fall towards $275.00 and then resume trading upwards with the target at $400.00. To confirm this “growth” scenario, the price must break $340.00, thus indicating that the reversal pattern is finished, however, this scenario may no longer be valid if the instrument falls and fixes below $235.00. In this case, the reversal pattern will be cancelled and the asset price will continue falling towards $165.00.
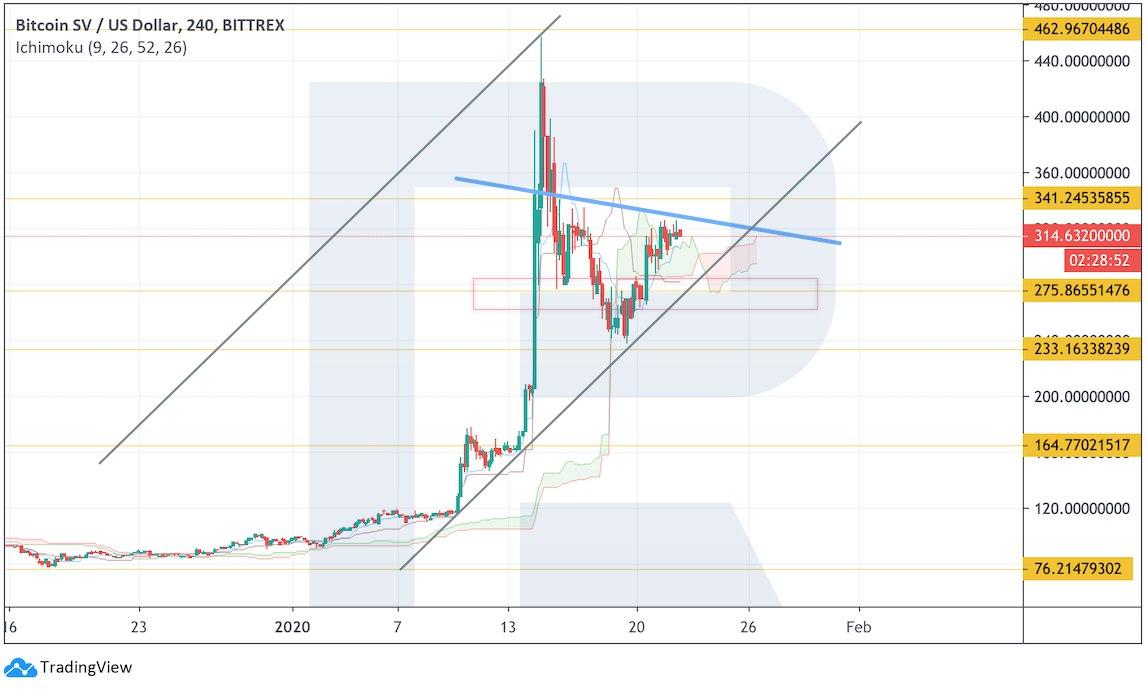
Photo: Roboforex / TradingView
Bitcoin Cash
In the daily chart, Bitcoin Cash is testing a critical resistance area at $365.00. If the price breaks this level, it may continue growing with the target at $457.00. However, we can see that the resistance line is being tested at RSI, thus indicating a descending correction from the current levels before further growth. The asset is expected to test the descending channel’s upside border at $265.00. However, this scenario may no longer be valid if the instrument falls to break $230.00. After that, the pair may continue trading downwards with the target at $160.00.
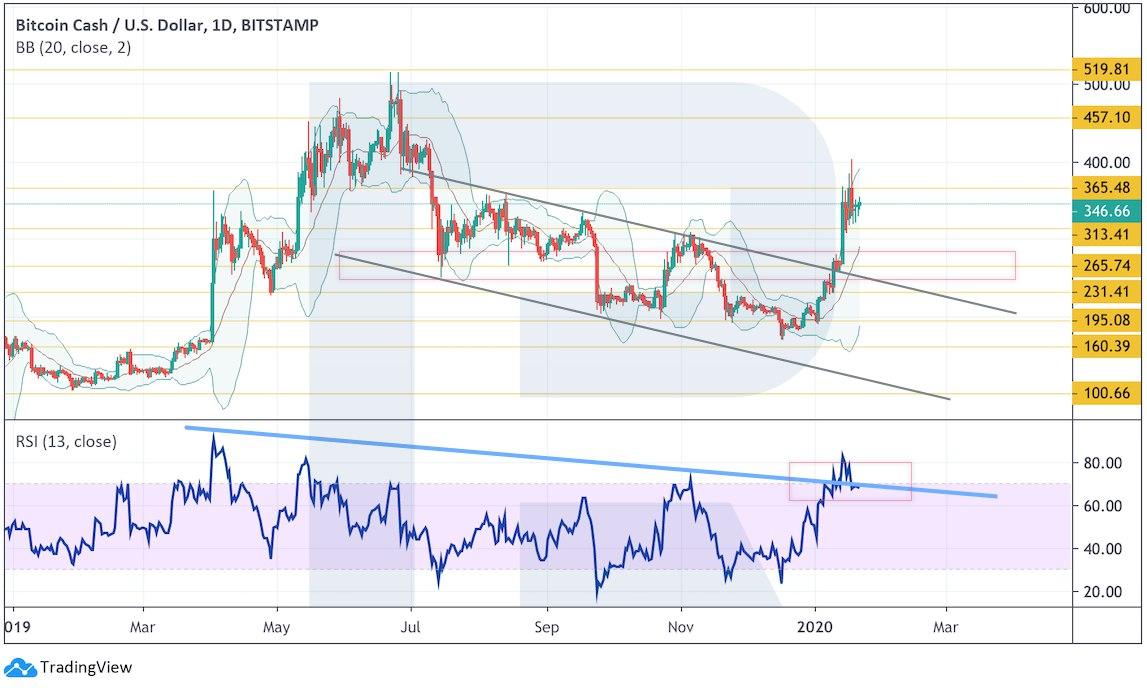
Photo: Roboforex / TradingView
At shorter timeframes, Bitcoin Cash is stuck inside Triangle. One shouldn’t exclude a possibility that the price may break the pattern upwards and boost its growth from the current levels. Another test of the support line at RSI confirms the above-mentioned scenario. Still, this scenario may be cancelled if the market falls to break Triangle’s downside border and fixes below $313.00. In this case, the asset is expected to continue trading downwards and test the descending channel’s upside border.
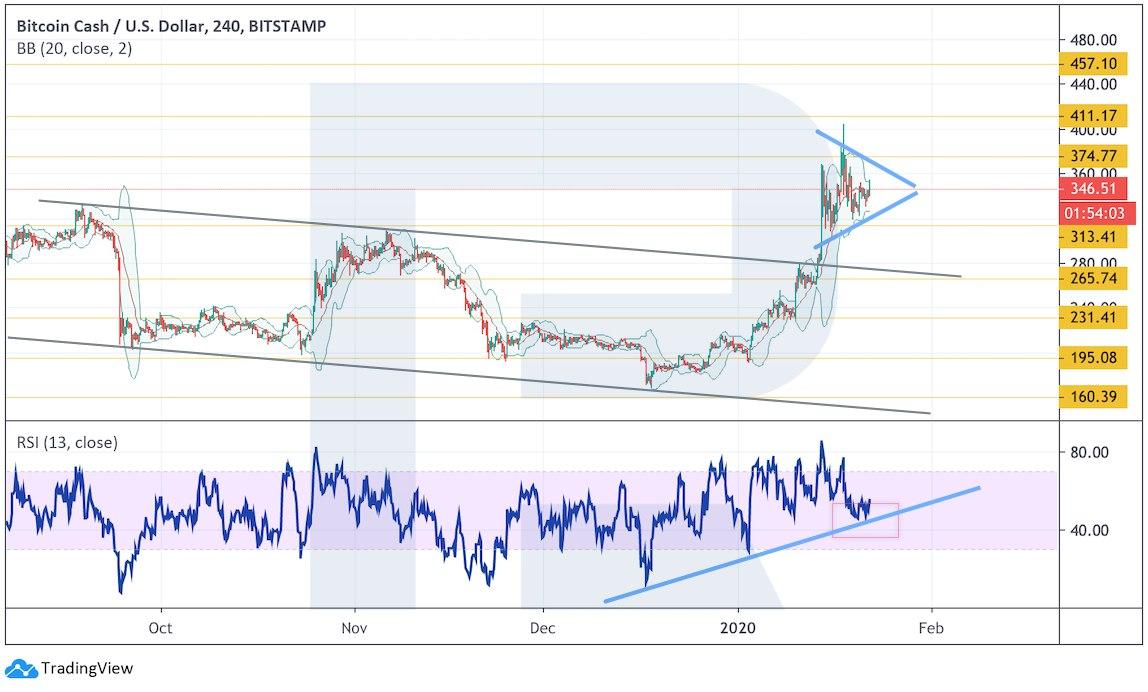
Photo: Roboforex / TradingView
Litecoin
In the daily chart, Litecoin is testing an important resistance level. At RSI, the downtrend line has been broken, now it’s a support level. Considering this, the main scenario implies that the price may fall a little bit to test $55.00 before starting a proper rising movement. A conservative scenario suggests that the asset may form Inverted Head & Shoulders pattern. In this case, the pair may fall to reach $50.00 and then resume growing to complete the pattern. However, this scenario may no longer be valid if the price breaks $42.00. In this case, the reversal pattern will be cancelled and the asset price will continue falling.
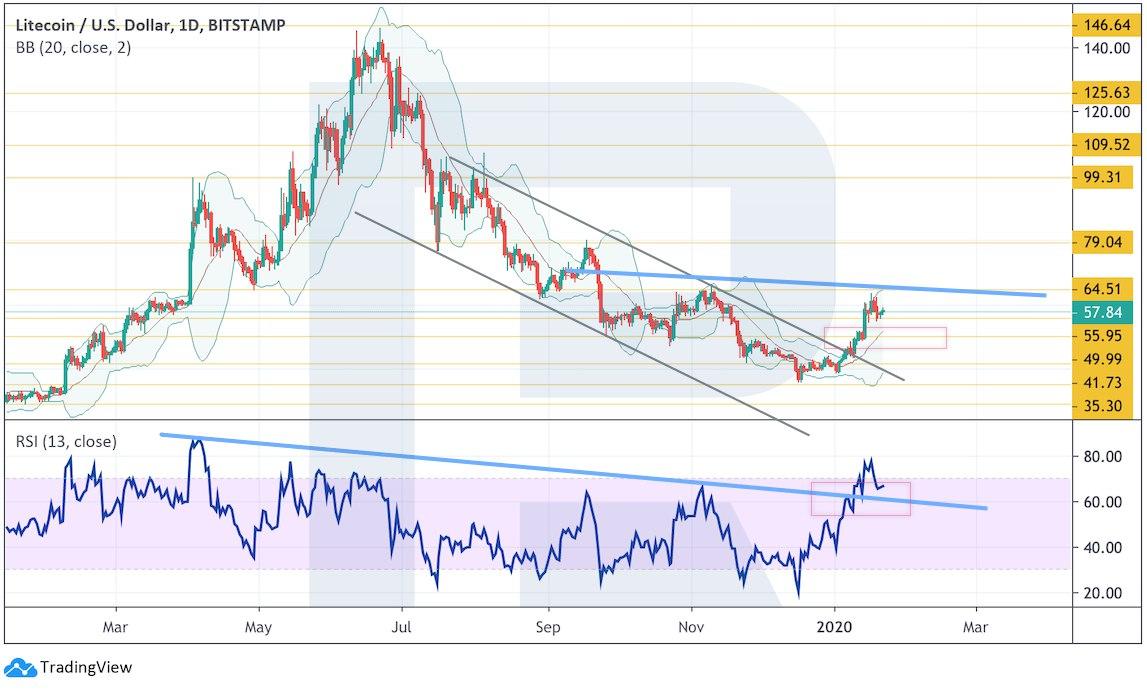
Photo: Roboforex / TradingView
As we can see in the H4 chart, Litecoin is trading inside the rising channel; it has rebounded from the support area while testing the downside border of Bollinger Bands. This suggests a bullish pressure. The main scenario implies that the price may continue growing with the first target at $79.00. To confirm this scenario, the asset must break $65.00. However, this scenario may be no longer valid if the instrument breaks $55.00. After that, it may continue falling towards $41.00.
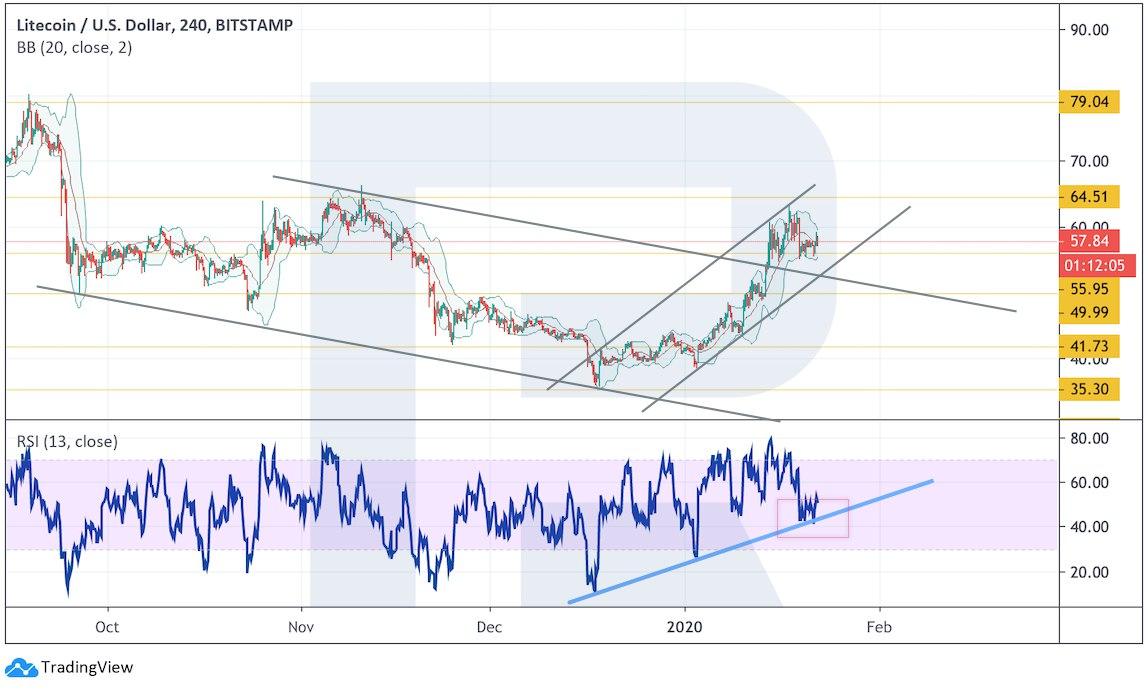
Photo: Roboforex / TradingView